Fig. 11
Download original image
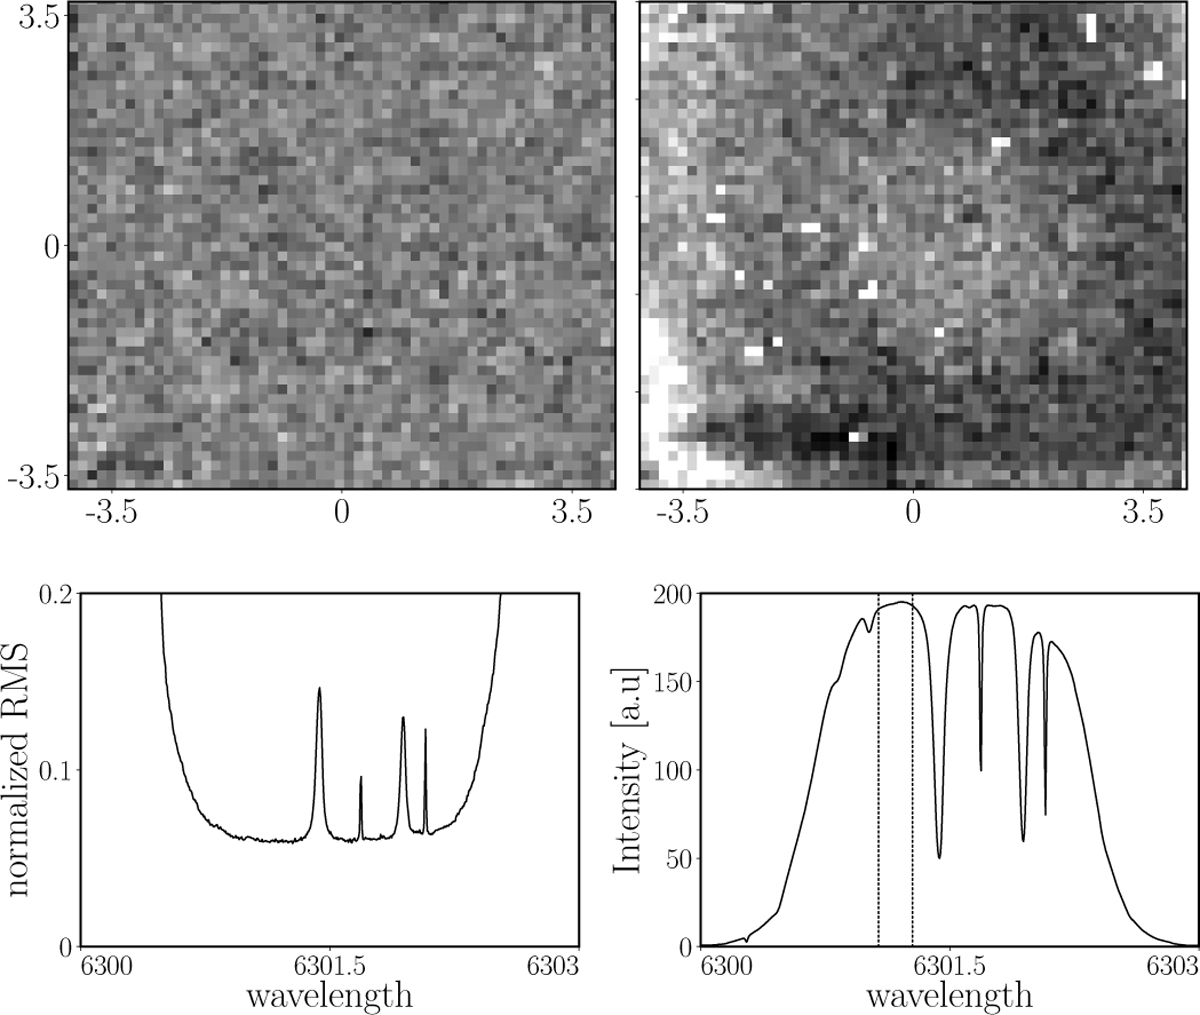
Noise properties of the extracted hyperspectral cubes. Top left: histogram-trimmed difference between two consecutive frames at the peak intensity wavelength in the continuum. Top right: normalized RMS of the spectrum in each pixel in the cleanest part of the continuum, indicated in the bottom-right panel. The intensity scale runs from 0.045 to 0.075. Bottom left: normalized RMS of the entire FOV as a function of wavelength. Bottom right: mean intensity over the FOV as a function of wavelength. The two vertical lines indicate the spectral region over which the normalized RMS in the map in the top right was calculated. The horizontal and vertical scales are in arcseconds.
Current usage metrics show cumulative count of Article Views (full-text article views including HTML views, PDF and ePub downloads, according to the available data) and Abstracts Views on Vision4Press platform.
Data correspond to usage on the plateform after 2015. The current usage metrics is available 48-96 hours after online publication and is updated daily on week days.
Initial download of the metrics may take a while.