Fig. 6
Download original image
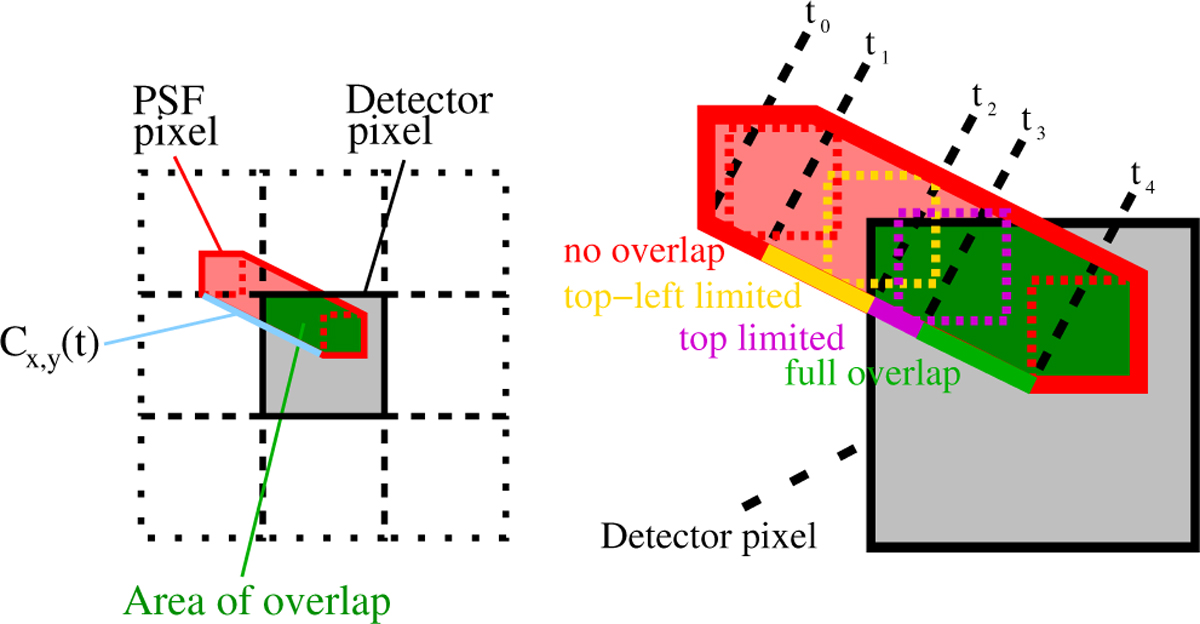
Example of a path integral of the area of overlap of one PSF pixel. Left: overview of an area of 3 × 3 dector pixels, showing the area covered by a PSF pixel, dispersed over a spectral interval [t0 − t4] (red/green), and the detector pixel under consideration (gray). Right: detail showing the path, which is split up in four different segments. The types of overlap are: none (t0 − t1), top + left limited (t1 − t2), top limited (t2 − t3), and full overlap (t3 − t4).
Current usage metrics show cumulative count of Article Views (full-text article views including HTML views, PDF and ePub downloads, according to the available data) and Abstracts Views on Vision4Press platform.
Data correspond to usage on the plateform after 2015. The current usage metrics is available 48-96 hours after online publication and is updated daily on week days.
Initial download of the metrics may take a while.