Fig. 5
Download original image
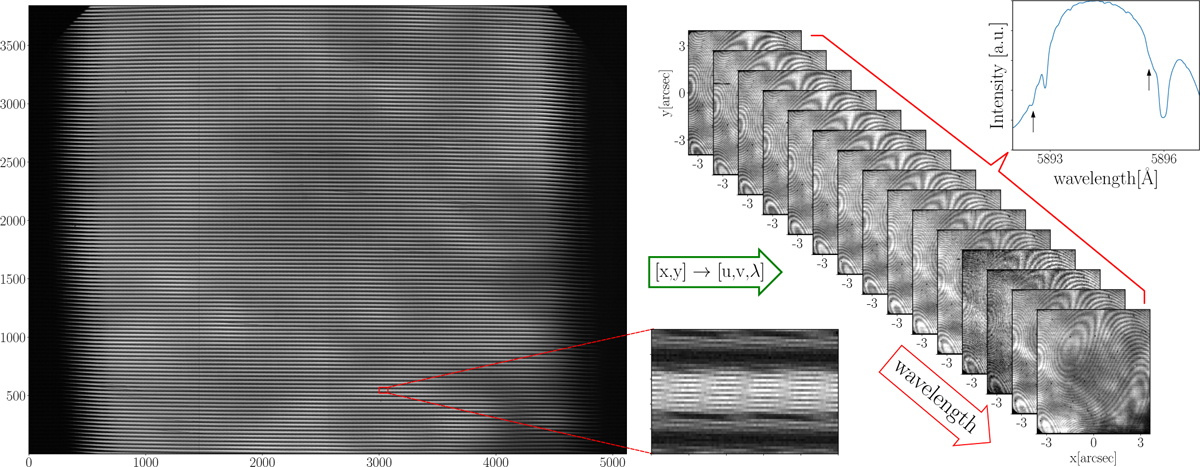
Example of a raw MiHI data frame, recorded in the spectral region from 5891 to 5897 Å, containing a Ni line at 5892.7 Å, and the Na D1 line at 5895.9 Å, mapped to a 3D hyperspectral cube using the pixel association map only. The interpolation of the darkfield corrected raw image (left) to a series of monochromatic images (diagonal) also maps the moiré pattern, leading to a quasi-periodic fringe pattern in the monochromatic images. The spectrum, averaged over the FOV, shows clear signs of spectral crosstalk, manifesting as parasitic spectral lines, highlighted by the black arrows in the plot of the average spectrum (top right). The core intensity of the Na D1 line, that should be approximately 5% of the continuum intensity, is nearly 22%, suggesting that in this spectral band approximately 15% of the extracted intensity is coming from the neighboring spectra.
Current usage metrics show cumulative count of Article Views (full-text article views including HTML views, PDF and ePub downloads, according to the available data) and Abstracts Views on Vision4Press platform.
Data correspond to usage on the plateform after 2015. The current usage metrics is available 48-96 hours after online publication and is updated daily on week days.
Initial download of the metrics may take a while.