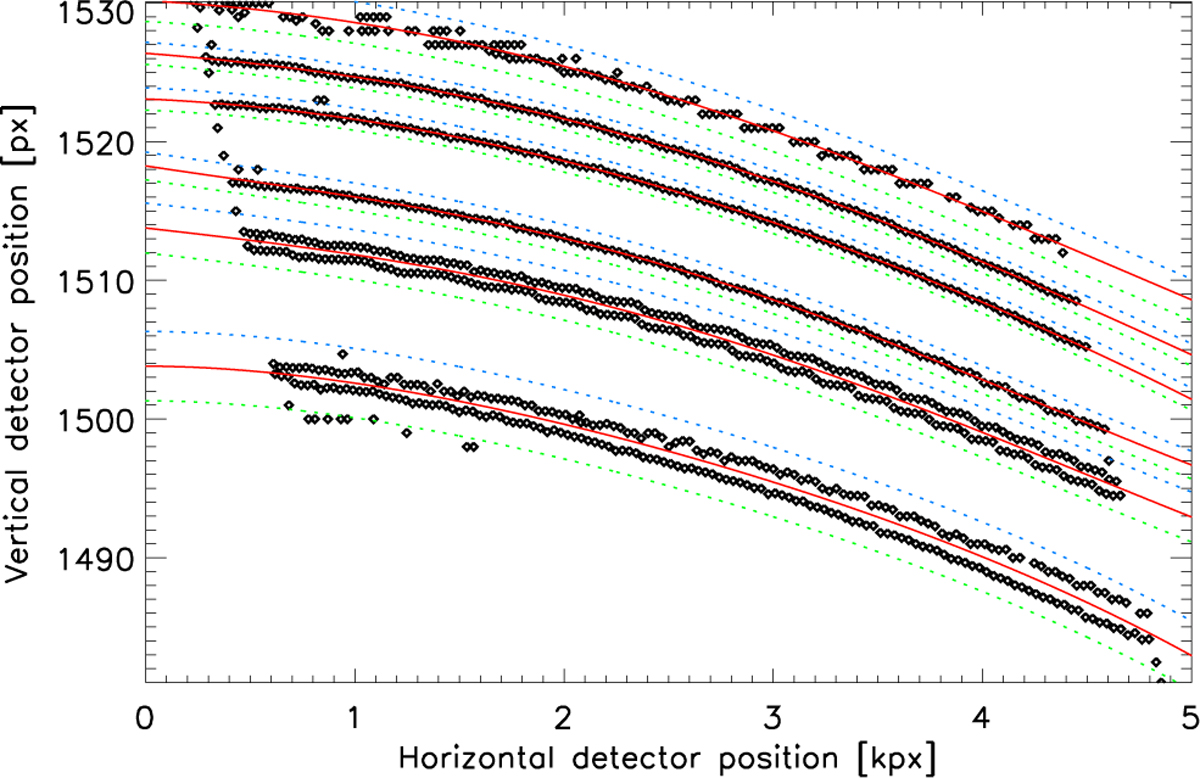
Fig. 4
Download original image
Spectral features (black diamonds) produced on the detector by telluric lines in the spectral band between 5894 A and 5898 A, for one of the central rows of image elements. The solid red lines are fits to the high-density bands in Fig. 3, and accurately follow the positions of the spectral features on the detector. All spectral features located within a band around each red line (i.e. the area between the blue and green dashed lines) can be identified as resulting from a specific telluric line. Pairs of lines that cannot always be separated in the histograms (i.e. the lowest two bands in upper panel of Fig. 3) can now easily be separated and identified.
Current usage metrics show cumulative count of Article Views (full-text article views including HTML views, PDF and ePub downloads, according to the available data) and Abstracts Views on Vision4Press platform.
Data correspond to usage on the plateform after 2015. The current usage metrics is available 48-96 hours after online publication and is updated daily on week days.
Initial download of the metrics may take a while.