Fig. 2
Download original image
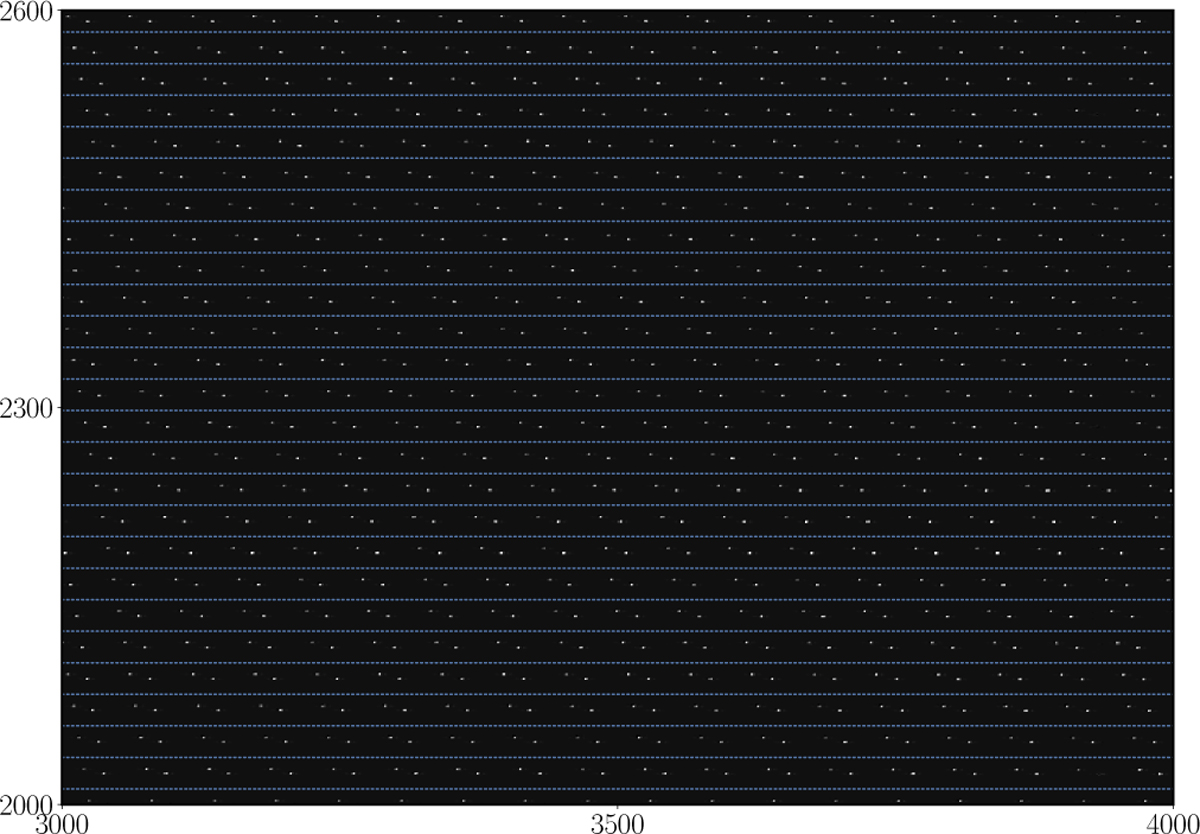
Example section of the ratio of a flat-field image, divided by another flat-field image recorded at a different solar elevation, for a 4 Å passband around 6302 Å. The blue dotted lines are the separation lines between the different rows of the MLA, the bright dots between the lines are produced by a pair of molecular O2 lines in this passband.
Current usage metrics show cumulative count of Article Views (full-text article views including HTML views, PDF and ePub downloads, according to the available data) and Abstracts Views on Vision4Press platform.
Data correspond to usage on the plateform after 2015. The current usage metrics is available 48-96 hours after online publication and is updated daily on week days.
Initial download of the metrics may take a while.