Fig. 13.
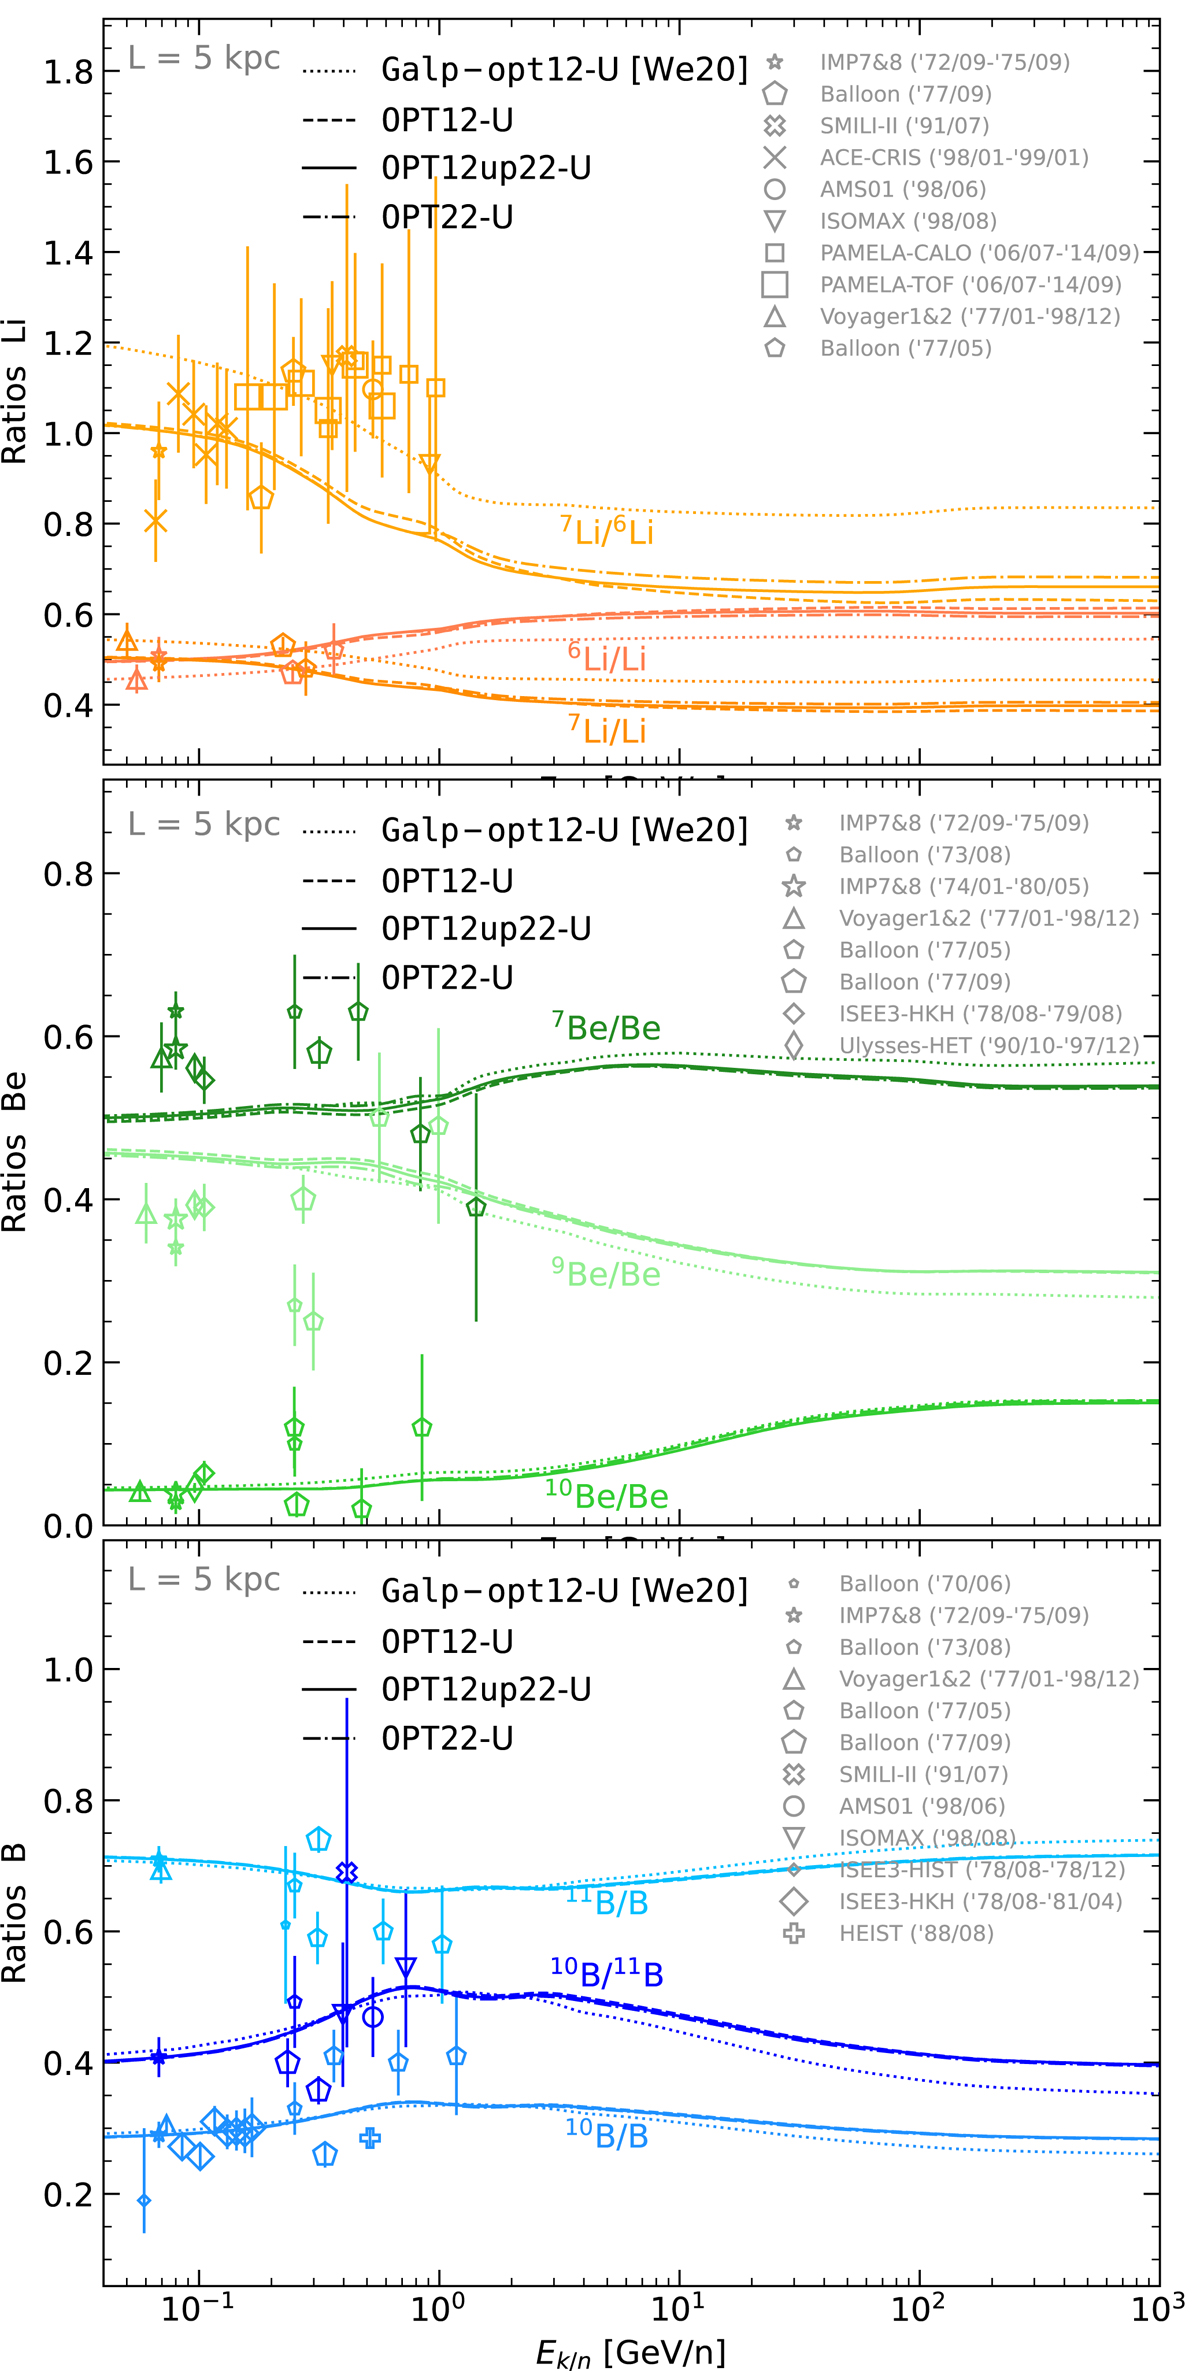
Download original image
Isotopic ratios of Li, Be, and B (from top to bottom panel) calculated from the best-fit models to AMS-02 LiBeB/C (at fixed L = 5 kpc). The production cross-section sets considered are the original Galp-opt12 (dotted lines) and the updated sets OPT12 (dashed lines), OPT12up22 (solid lines), and OPT22 (dash-dotted lines); the suffix ‘-U’ in the labels recalls that we use here unbiased cross-section sets, see Eq. (11). The data are from IMP (Garcia-Munoz et al. 1977a,b, 1981), Balloon ’73/08 (Hagen et al. 1977), Balloon ’77/05 (Buffington et al. 1978), Balloon ’77/09 (Webber & Kish 1979), Balloon ’70/06 (Bjarle et al. 1979), ISEE3 (Wiedenbeck & Greiner 1980; Mewaldt et al. 1981; Krombel & Wiedenbeck 1988), HEIST (Gibner et al. 1992), Ulysses (Connell 1998), Voyager1&2 (Lukasiak 1999), SMILI-II (Ahlen et al. 2000), ISOMAX (Hams et al. 2004), ACE (Yanasak et al. 2001; de Nolfo et al. 2006), AMS-01 (Aguilar et al. 2011), PAMELA (Menn et al. 2018; Nozzoli & Cernetti 2021).
Current usage metrics show cumulative count of Article Views (full-text article views including HTML views, PDF and ePub downloads, according to the available data) and Abstracts Views on Vision4Press platform.
Data correspond to usage on the plateform after 2015. The current usage metrics is available 48-96 hours after online publication and is updated daily on week days.
Initial download of the metrics may take a while.