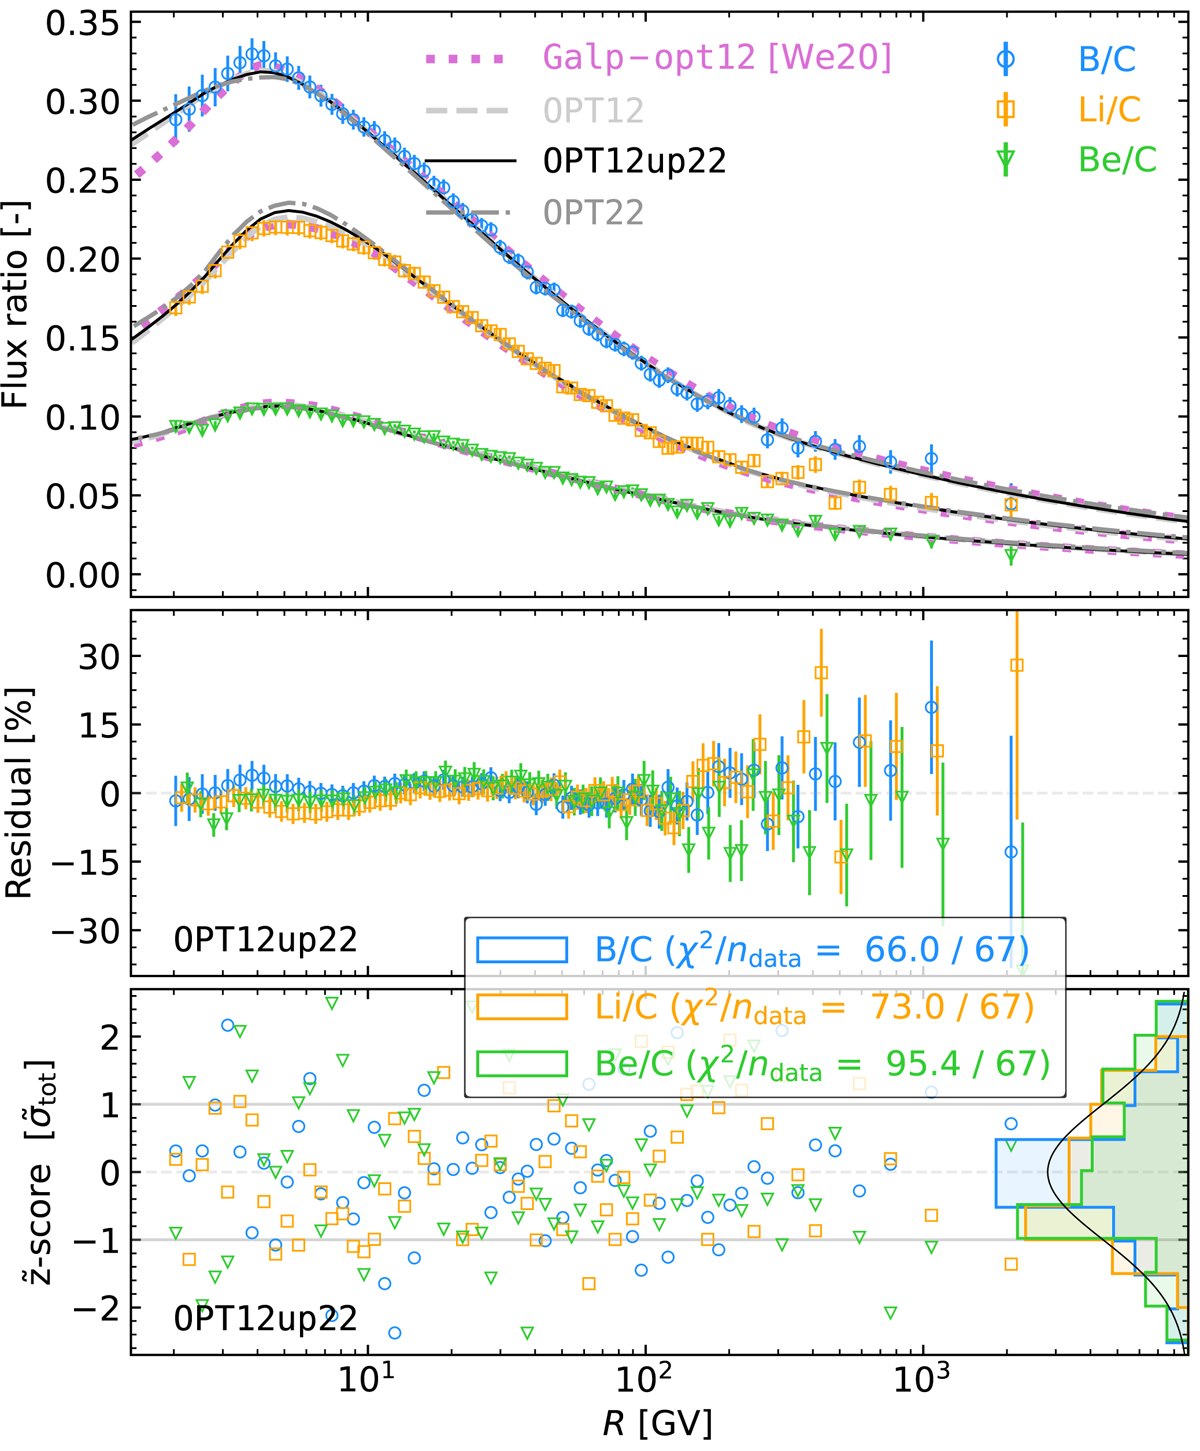
Fig. 11.
Download original image
Flux ratios (top), residuals (centre) and ![]() -scores (bottom) for B/C (blue circles), Be/C (green triangles), and Li/C (orange squares). The models (top panel) are calculated from the best-fit transport parameters (combined LiBeB/C analysis) using the original Galp-opt12 set (thick violet dotted line) or our updated sets: OPT12 (dashed grey line), OPT12up22 (solid black line), and OPT22 (dashed-dotted grey line). The residuals and
-scores (bottom) for B/C (blue circles), Be/C (green triangles), and Li/C (orange squares). The models (top panel) are calculated from the best-fit transport parameters (combined LiBeB/C analysis) using the original Galp-opt12 set (thick violet dotted line) or our updated sets: OPT12 (dashed grey line), OPT12up22 (solid black line), and OPT22 (dashed-dotted grey line). The residuals and ![]() -score are shown for SLIM only – the
-score are shown for SLIM only – the ![]() -score is related to the usual z-score by a rotation in a base where the covariance matrix of data systematics is diagonal (see text for details).
-score is related to the usual z-score by a rotation in a base where the covariance matrix of data systematics is diagonal (see text for details).
Current usage metrics show cumulative count of Article Views (full-text article views including HTML views, PDF and ePub downloads, according to the available data) and Abstracts Views on Vision4Press platform.
Data correspond to usage on the plateform after 2015. The current usage metrics is available 48-96 hours after online publication and is updated daily on week days.
Initial download of the metrics may take a while.