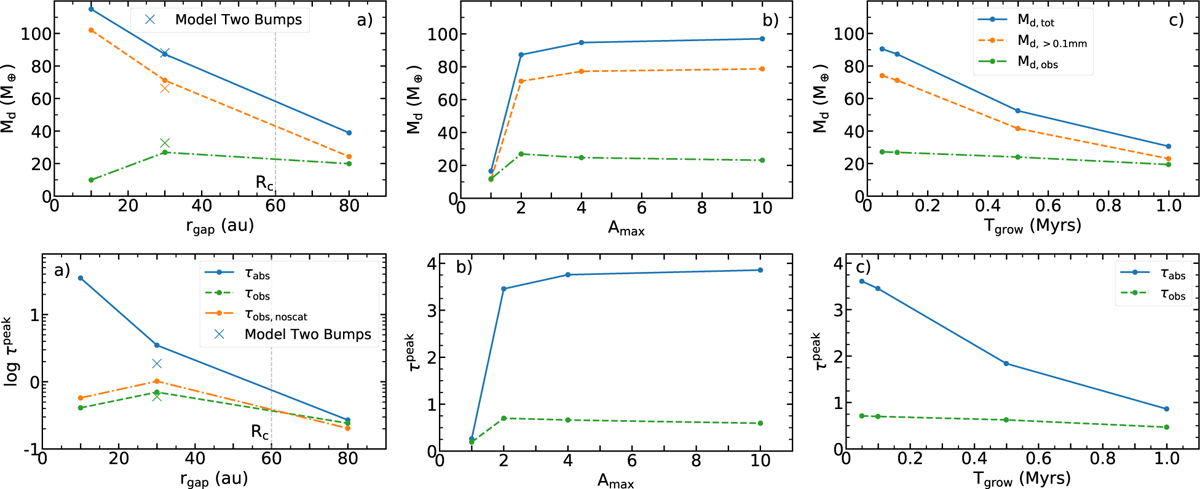
Fig. 4

Download original image
Dust mass and optical depth parameter plots. (Upper) Total dust mass (blue), dust mass for grains larger than 0.1 mm (orange) and observed dust mass (green) plotted over the gap location, bump amplitude and bump growth time (from a-c). (Lower) Absorption and observed peak optical depth also in dependence on bump model parameters. The Inner Bump model reaches τabs = 35, which is why we used a logarithmic scale in subplot (a).
Current usage metrics show cumulative count of Article Views (full-text article views including HTML views, PDF and ePub downloads, according to the available data) and Abstracts Views on Vision4Press platform.
Data correspond to usage on the plateform after 2015. The current usage metrics is available 48-96 hours after online publication and is updated daily on week days.
Initial download of the metrics may take a while.


