Open Access
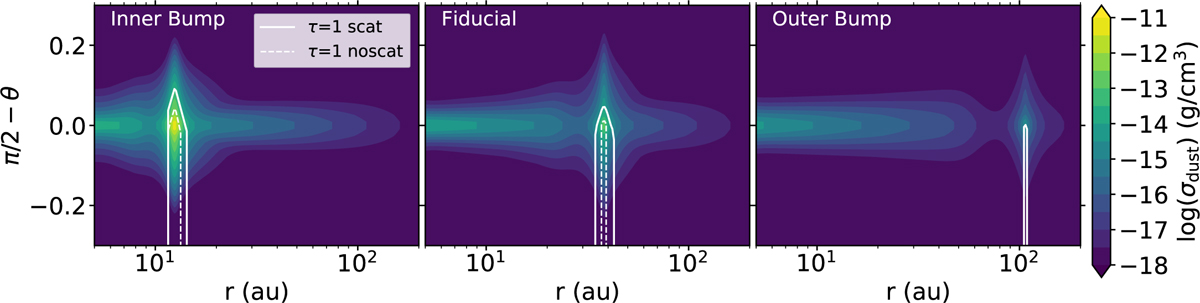
Fig. 10
Download original image
Vertical and radial dust density distribution. Shown are the models with varying gap locations after 1 Myr of evolution, over-plotted by the contours of the optical depth emission surface corresponding to τ = 1 with either treatment of full (solid) or no (dashed) scattering.
Current usage metrics show cumulative count of Article Views (full-text article views including HTML views, PDF and ePub downloads, according to the available data) and Abstracts Views on Vision4Press platform.
Data correspond to usage on the plateform after 2015. The current usage metrics is available 48-96 hours after online publication and is updated daily on week days.
Initial download of the metrics may take a while.