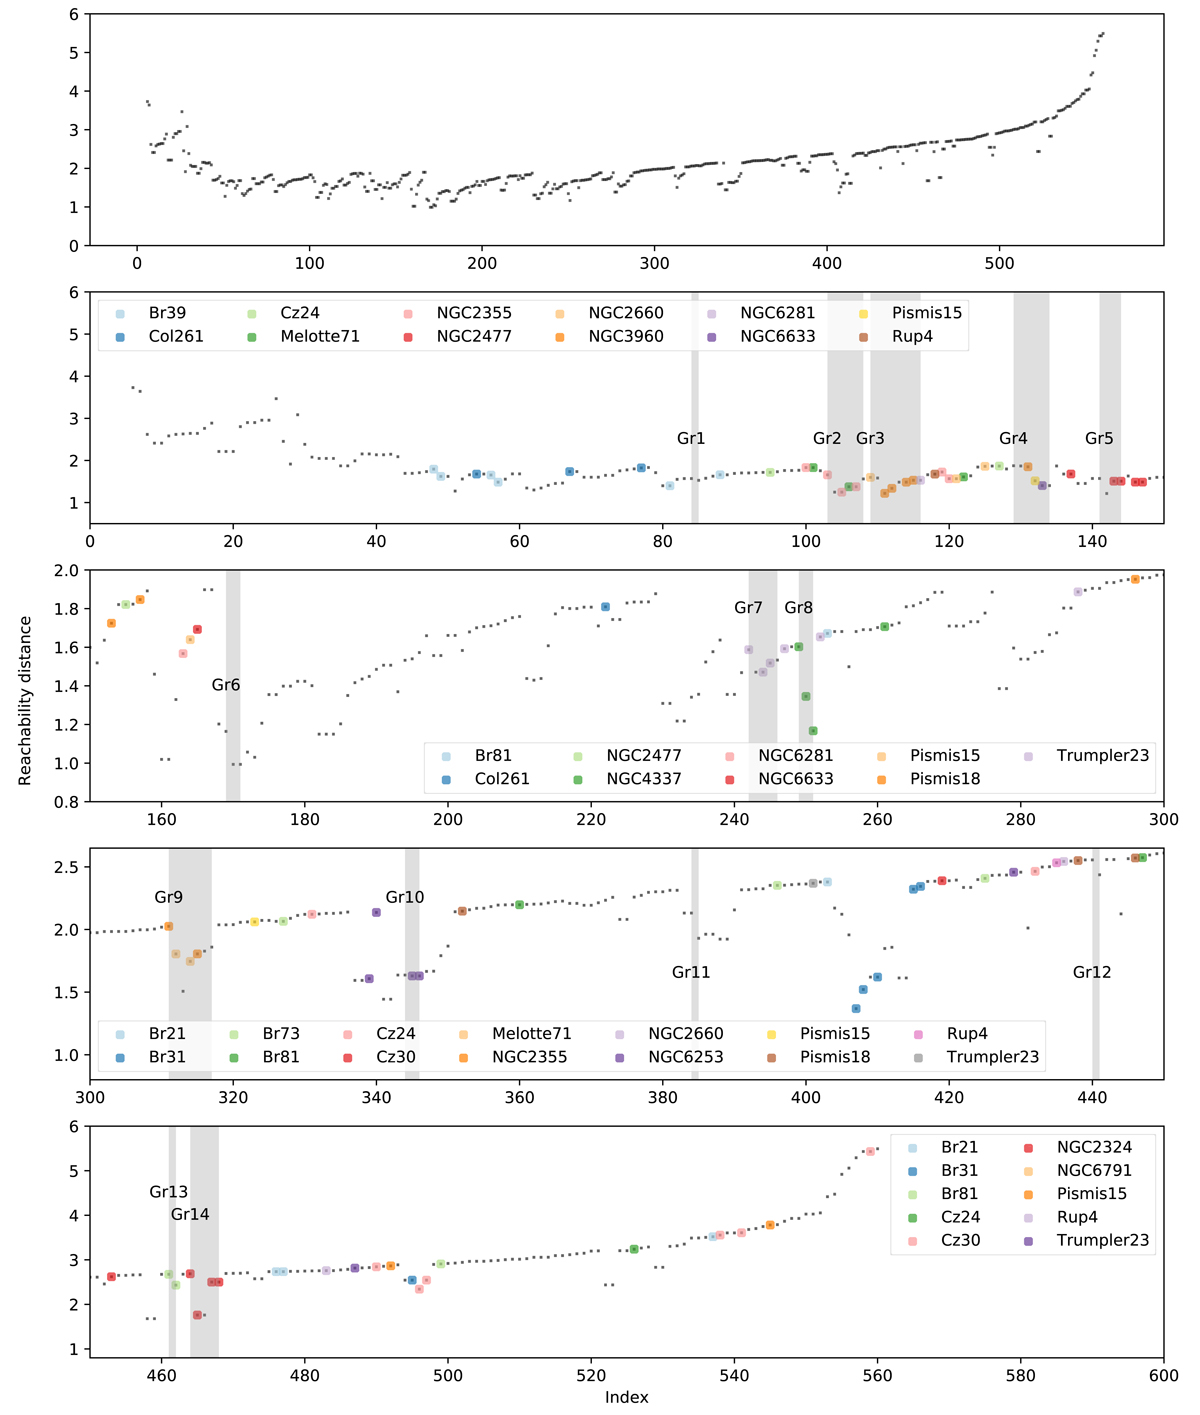
Fig. 7.
Download original image
The panels show the reachability plots resulting from the blind clustering analysis of the data set composed by field stars and hidden open clusters. Top panel: entire reachability plot across the full data set. The following panels show smaller portions of the reachability plot of 150 instances each. Stellar members of the 23 open clusters of the hidden sample are shown as coloured points. The gray points correspond to the field stars. The shaded vertical bands highlight the location of the 14 groups of interest identified as in Sect. 4.3.
Current usage metrics show cumulative count of Article Views (full-text article views including HTML views, PDF and ePub downloads, according to the available data) and Abstracts Views on Vision4Press platform.
Data correspond to usage on the plateform after 2015. The current usage metrics is available 48-96 hours after online publication and is updated daily on week days.
Initial download of the metrics may take a while.