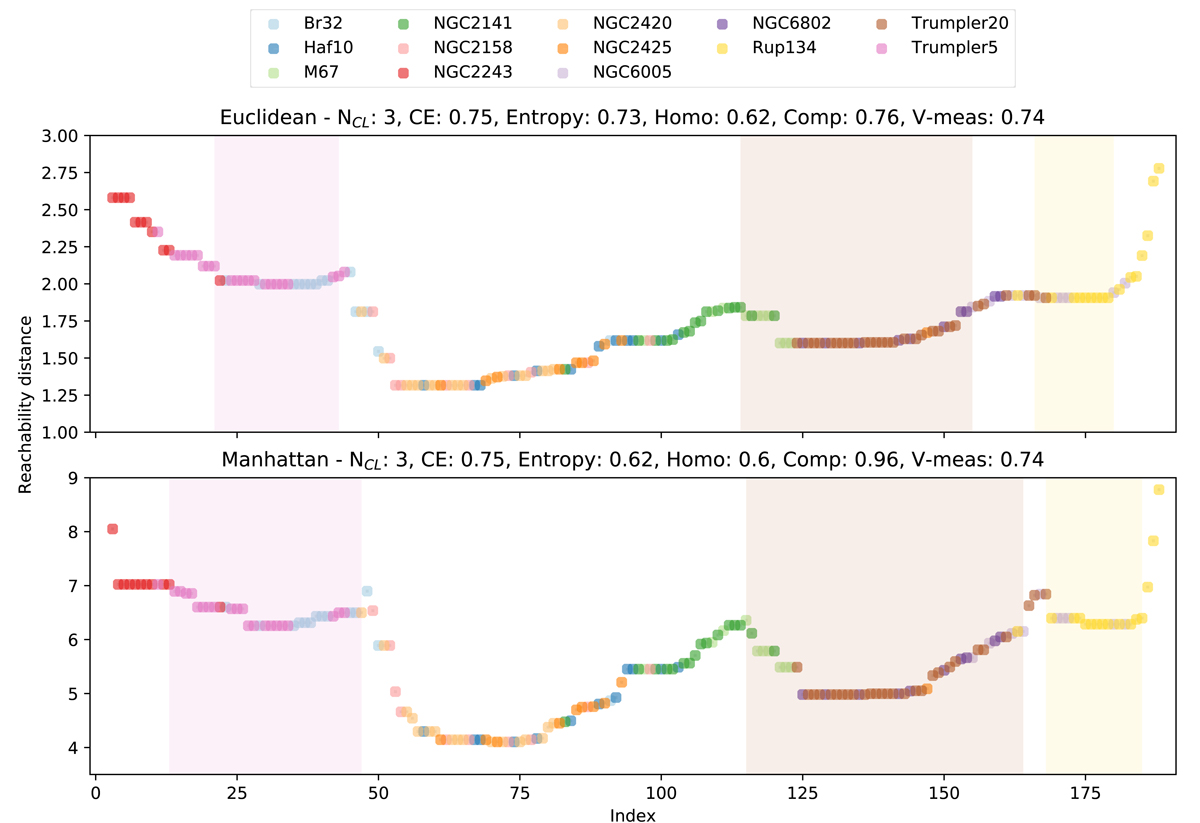
Fig. 3.
Download original image
The panels show the reachability plots resulting from clustering with different metrics. The points are color coded depending on the cluster they are member of. The relevant coefficients and scores are listed on top of each panel. Top panel: reachability plot obtained with the Euclidean metric. Bottom panel: reachability plot obtained with the Manhattan metric.
Current usage metrics show cumulative count of Article Views (full-text article views including HTML views, PDF and ePub downloads, according to the available data) and Abstracts Views on Vision4Press platform.
Data correspond to usage on the plateform after 2015. The current usage metrics is available 48-96 hours after online publication and is updated daily on week days.
Initial download of the metrics may take a while.