Fig. 2.
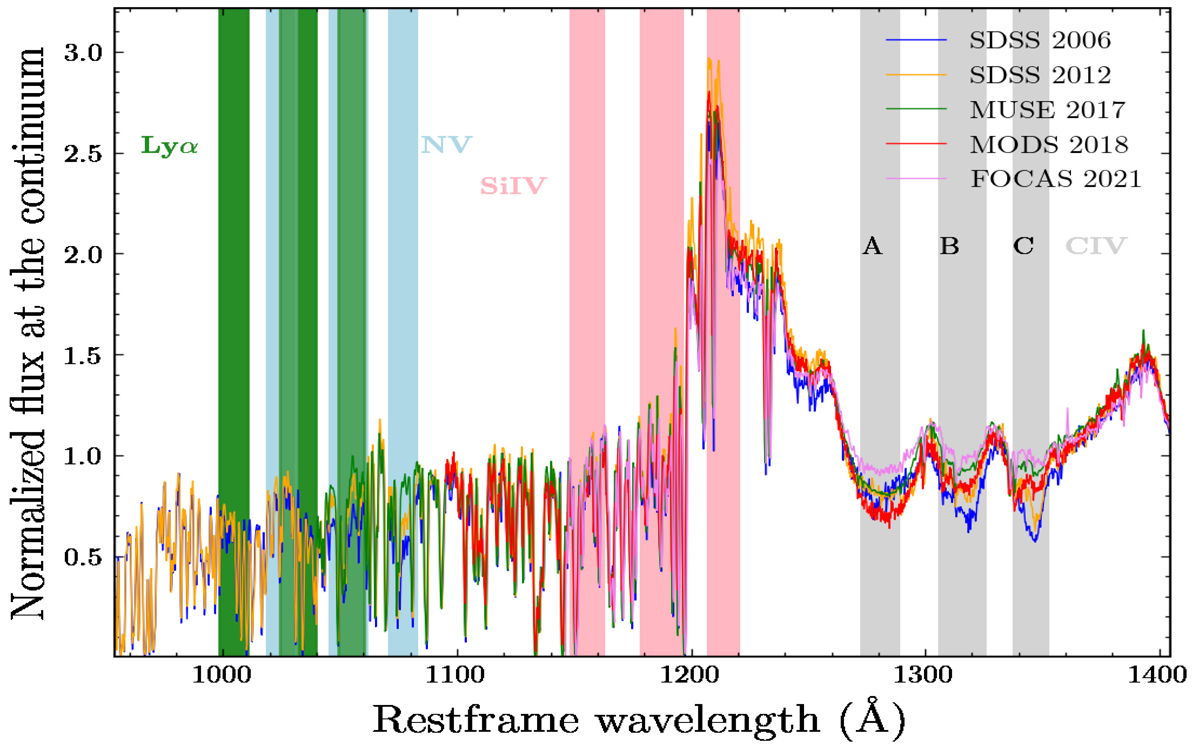
Download original image
Comparison of the optical spectra of J1538+0855 taken at different epochs (see Table 1, with the observed locations of CIV absorption troughs A, B, and C marked as grey-shaded regions. The expected positions of the corresponding SiIV (pink), NV (cyan), Lyα (green), and OVI (coral) absorption are also shown as shaded regions.
Current usage metrics show cumulative count of Article Views (full-text article views including HTML views, PDF and ePub downloads, according to the available data) and Abstracts Views on Vision4Press platform.
Data correspond to usage on the plateform after 2015. The current usage metrics is available 48-96 hours after online publication and is updated daily on week days.
Initial download of the metrics may take a while.