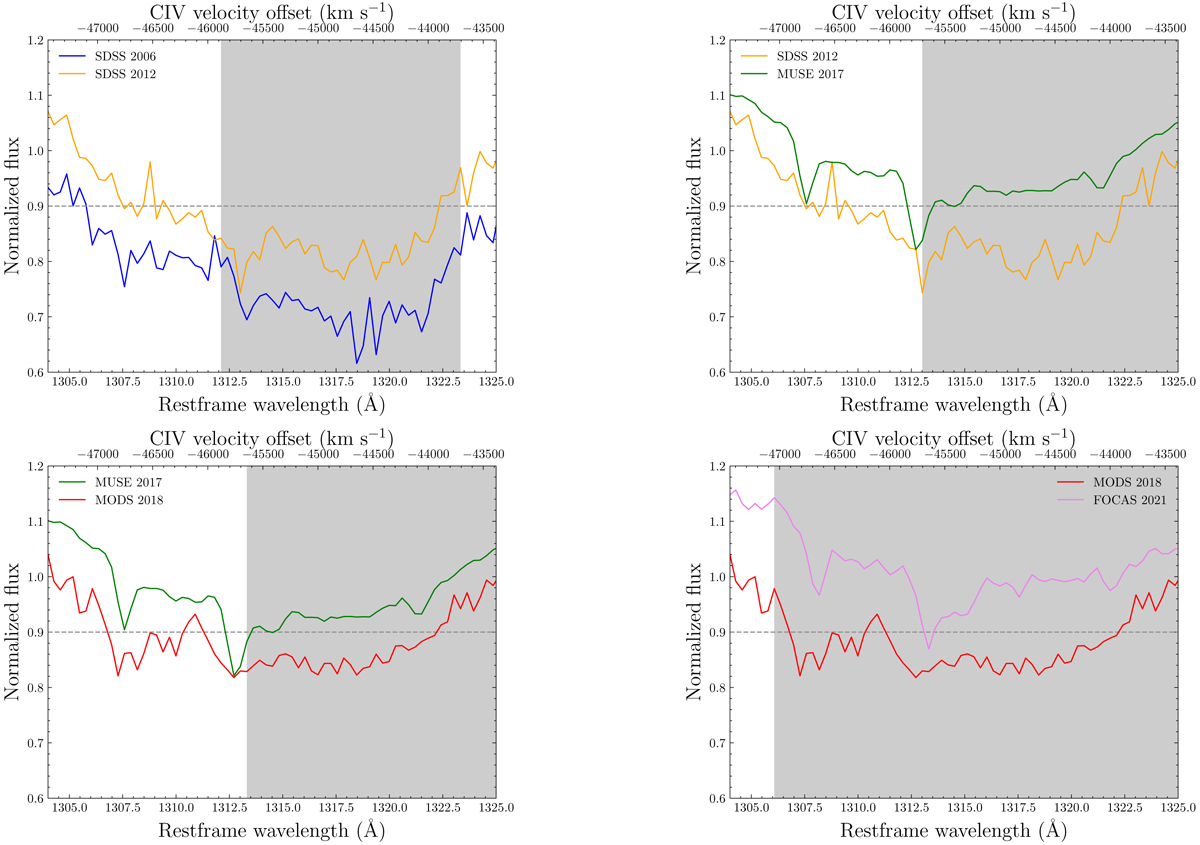
Fig. C.2.
Download original image
Comparison of spectra taken at two consecutive epochs over the velocity interval of the CIV B trough. The shaded region marks where the spectrum varies between the two epochs, which is used to define the region within which the As absorption strength is measured. The dashed line represents the 90% level of the continuum-normalized flux.
Current usage metrics show cumulative count of Article Views (full-text article views including HTML views, PDF and ePub downloads, according to the available data) and Abstracts Views on Vision4Press platform.
Data correspond to usage on the plateform after 2015. The current usage metrics is available 48-96 hours after online publication and is updated daily on week days.
Initial download of the metrics may take a while.