Open Access
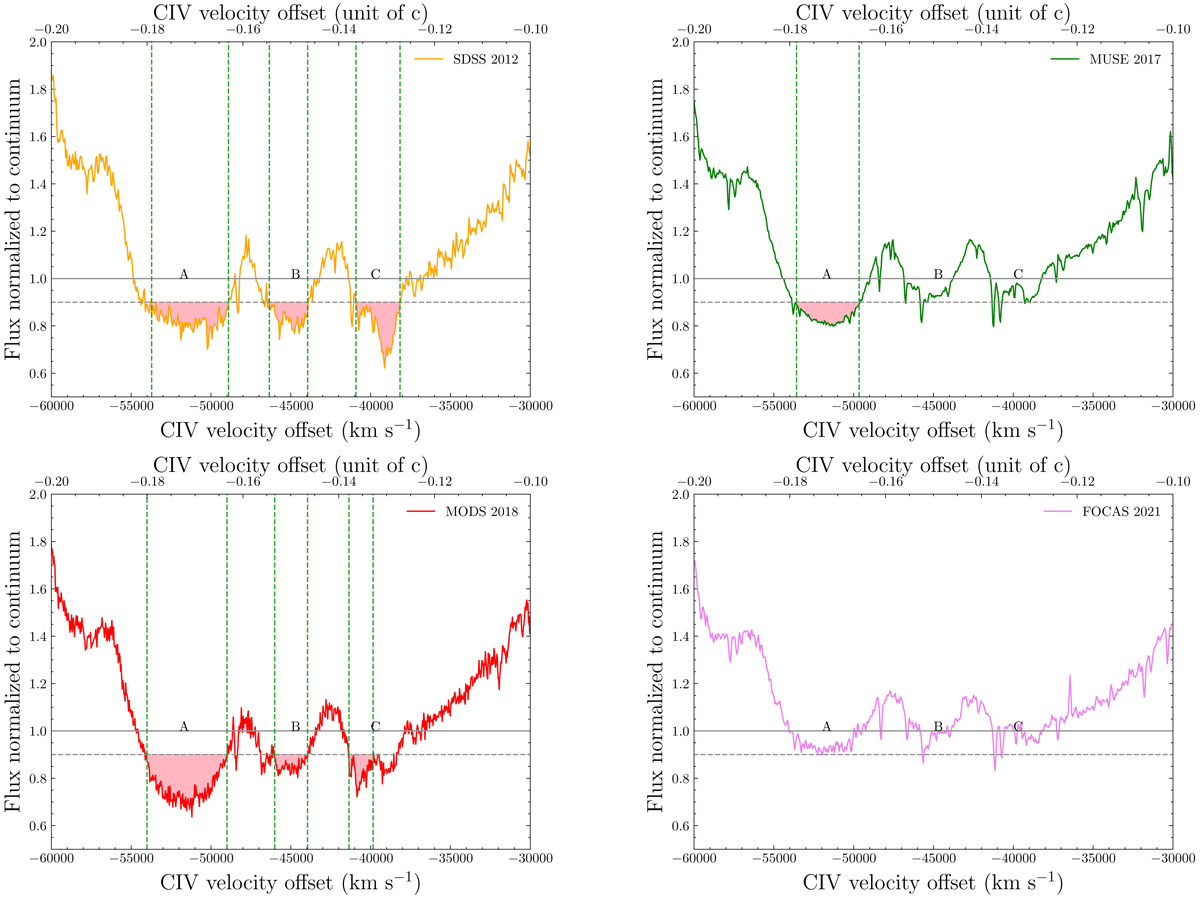
Fig. B.1.
Download original image
Light pink regions represent the absorptions below 90% of the continuum. Green-dashed lines indicate the minimum and maximum velocity estimated for the BAL outflow in each trough. The horizontal dashed line represents the 90% level of the continuum-normalized flux.
Current usage metrics show cumulative count of Article Views (full-text article views including HTML views, PDF and ePub downloads, according to the available data) and Abstracts Views on Vision4Press platform.
Data correspond to usage on the plateform after 2015. The current usage metrics is available 48-96 hours after online publication and is updated daily on week days.
Initial download of the metrics may take a while.