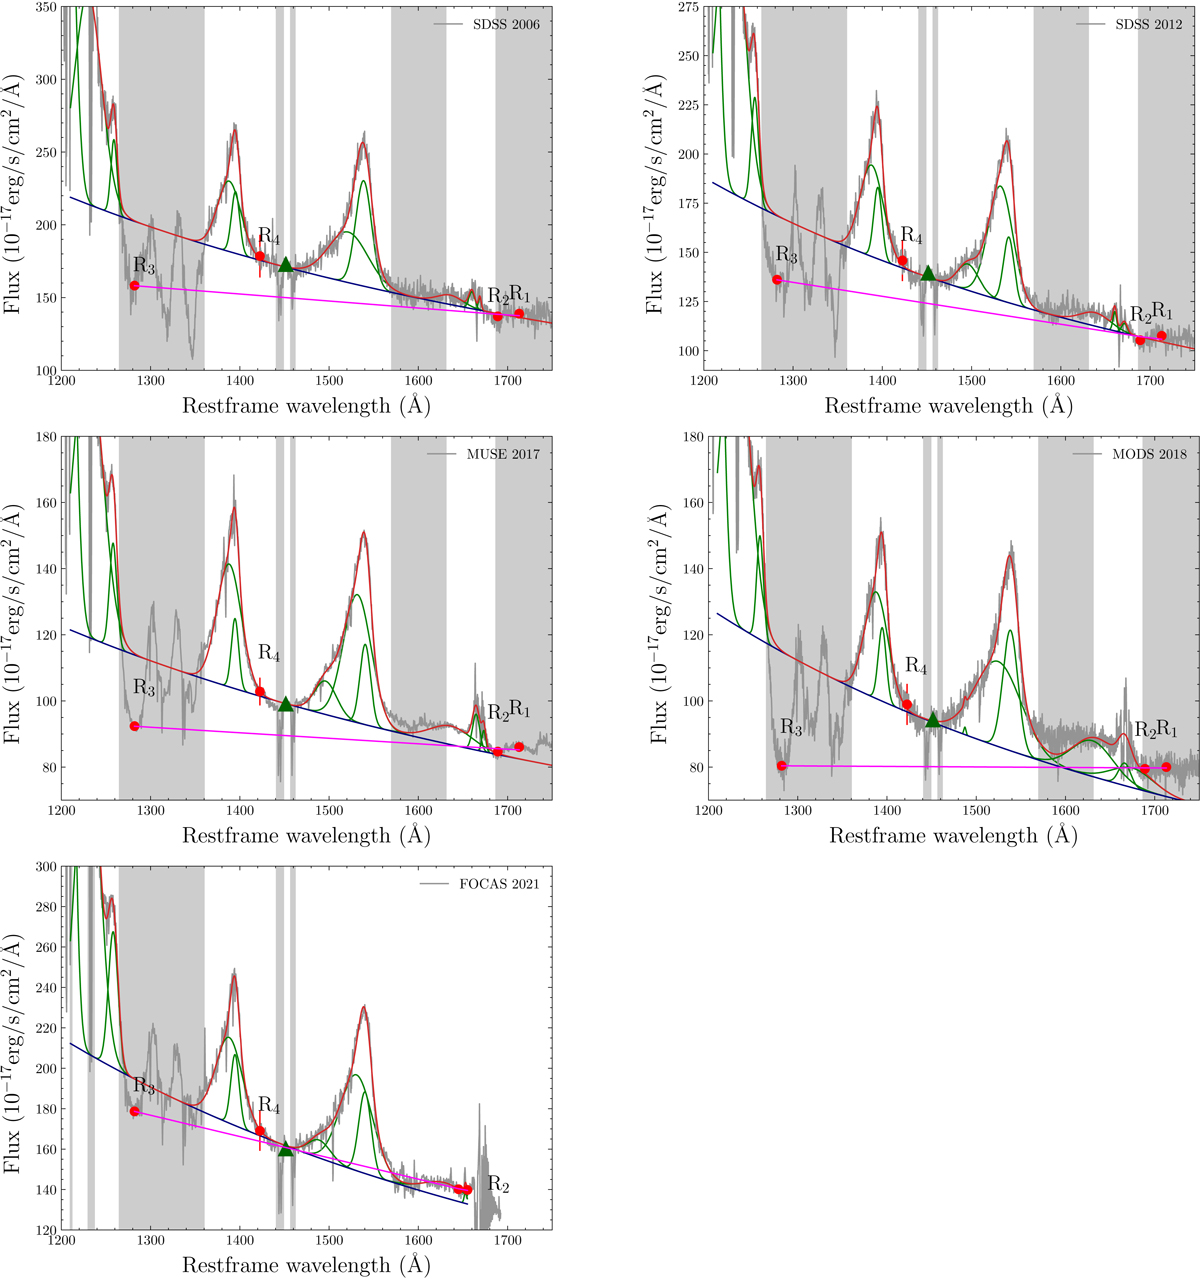
Fig. A.1.
Download original image
Spectra of J1538+0855 (grey), showing our best-fit model for each epoch (red). The grey bands represent the regions masked during the continuum and emission lines’ fit. We fitted a power law (blue) to the spectrum and Gaussian functions for the emission lines (green curves). The best-fit power law derived following the method of RH20 is shown as a solid magenta line, along with points R1 (median flux of points with rest-frame wavelengths between 1701 and 1725 Å), R2 (1677–1701 Å), R3 (1280–1284 Å), and R4 (1415–1430 Å) being used to define and anchor the power-law slope. The green triangle was used as reference for the continuum level since the R4 point falls within the red end of the SiIV emission line.
Current usage metrics show cumulative count of Article Views (full-text article views including HTML views, PDF and ePub downloads, according to the available data) and Abstracts Views on Vision4Press platform.
Data correspond to usage on the plateform after 2015. The current usage metrics is available 48-96 hours after online publication and is updated daily on week days.
Initial download of the metrics may take a while.