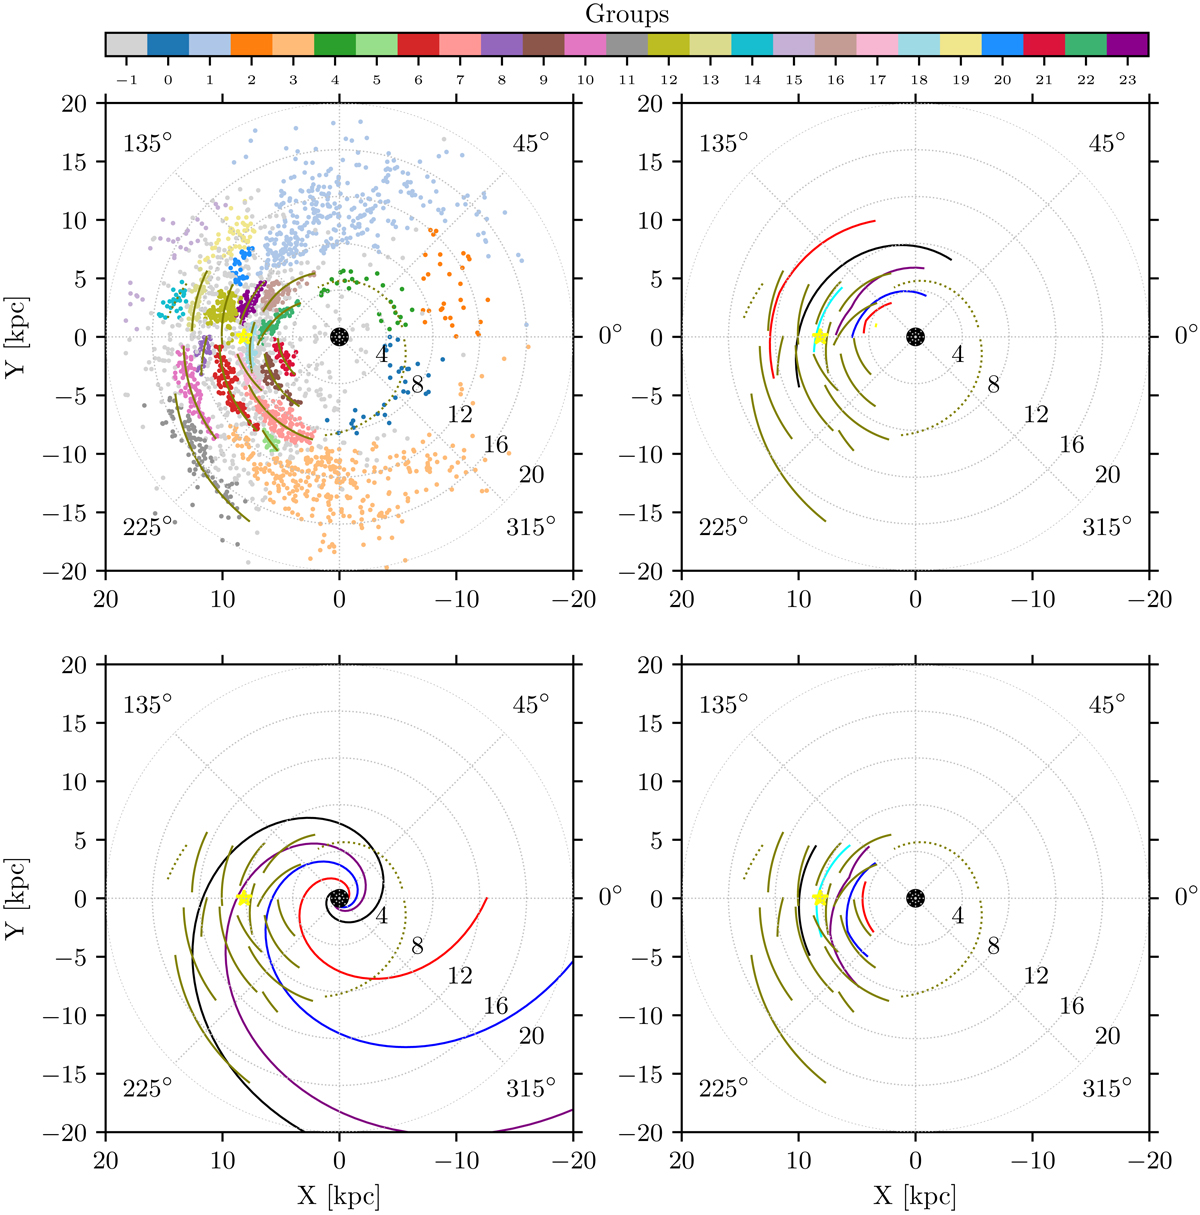
Fig. 8.
Download original image
Comparison with previous models. Top left: spiral segments (olive) over-plotted on Cepheids identified as members of a group. Groups are color-coded as in Fig. 7. Top right: spiral segments and the model of Reid et al. (2019). The spiral arms delineated by Reid et al. (2019) are over-plotted using the same color-coding as in the original paper. Bottom left: spiral segments and the model of Levine et al. (2006b), with the same color-coding as in Reid et al. (2019). Bottom right: spiral segments and the model of Hou (2021), with the same color-coding as in Reid et al. (2019).
Current usage metrics show cumulative count of Article Views (full-text article views including HTML views, PDF and ePub downloads, according to the available data) and Abstracts Views on Vision4Press platform.
Data correspond to usage on the plateform after 2015. The current usage metrics is available 48-96 hours after online publication and is updated daily on week days.
Initial download of the metrics may take a while.