Fig. 8.
Download original image
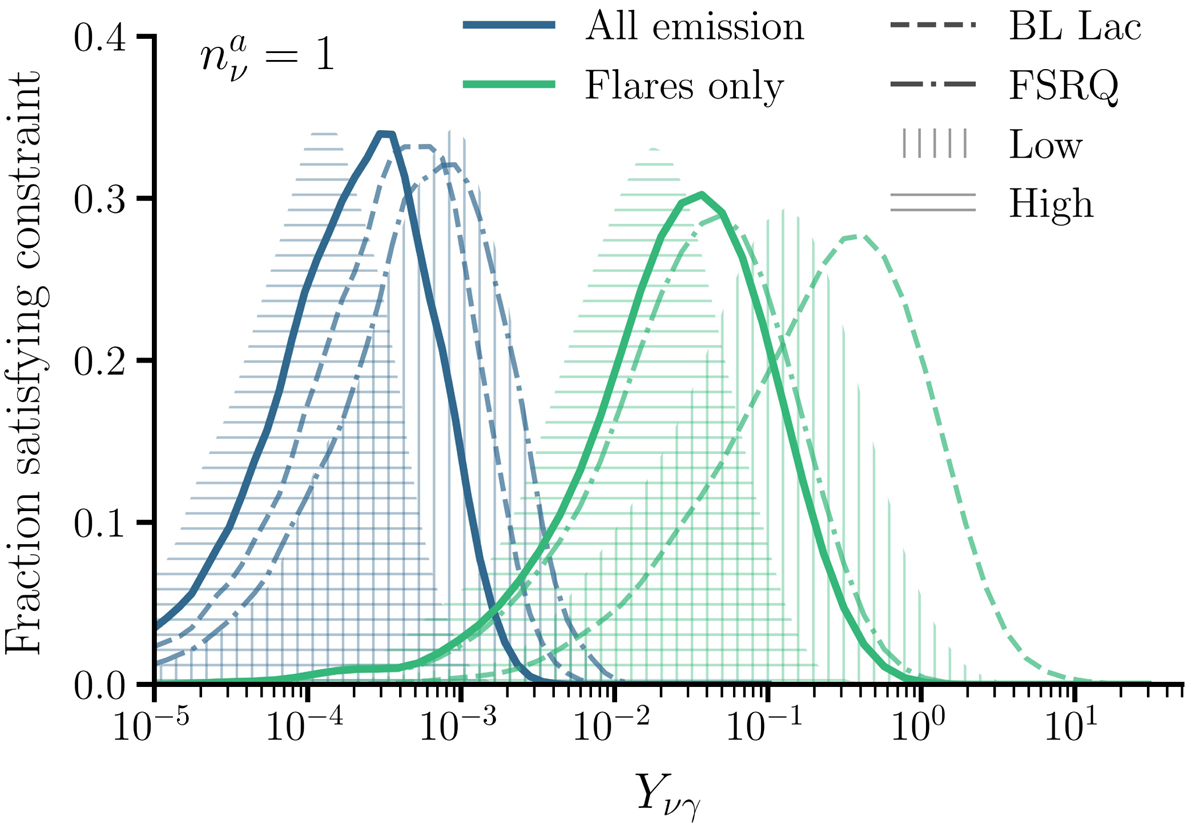
Fraction of simulated surveys satisfying ![]() is shown for a range of Yνγ values. The blue lines show the results when considering both steady-state and flaring neutrino emission from blazars, and the green lines show the results from only flaring emission. For each case, the dashed and dash-dotted lines show the results for the BL Lac and FSRQ populations, respectively. The hatched areas show the results for the higher and lower blazar population models introduced in Sect. 3.1.
is shown for a range of Yνγ values. The blue lines show the results when considering both steady-state and flaring neutrino emission from blazars, and the green lines show the results from only flaring emission. For each case, the dashed and dash-dotted lines show the results for the BL Lac and FSRQ populations, respectively. The hatched areas show the results for the higher and lower blazar population models introduced in Sect. 3.1.
Current usage metrics show cumulative count of Article Views (full-text article views including HTML views, PDF and ePub downloads, according to the available data) and Abstracts Views on Vision4Press platform.
Data correspond to usage on the plateform after 2015. The current usage metrics is available 48-96 hours after online publication and is updated daily on week days.
Initial download of the metrics may take a while.