Open Access
Fig. 7.
Download original image
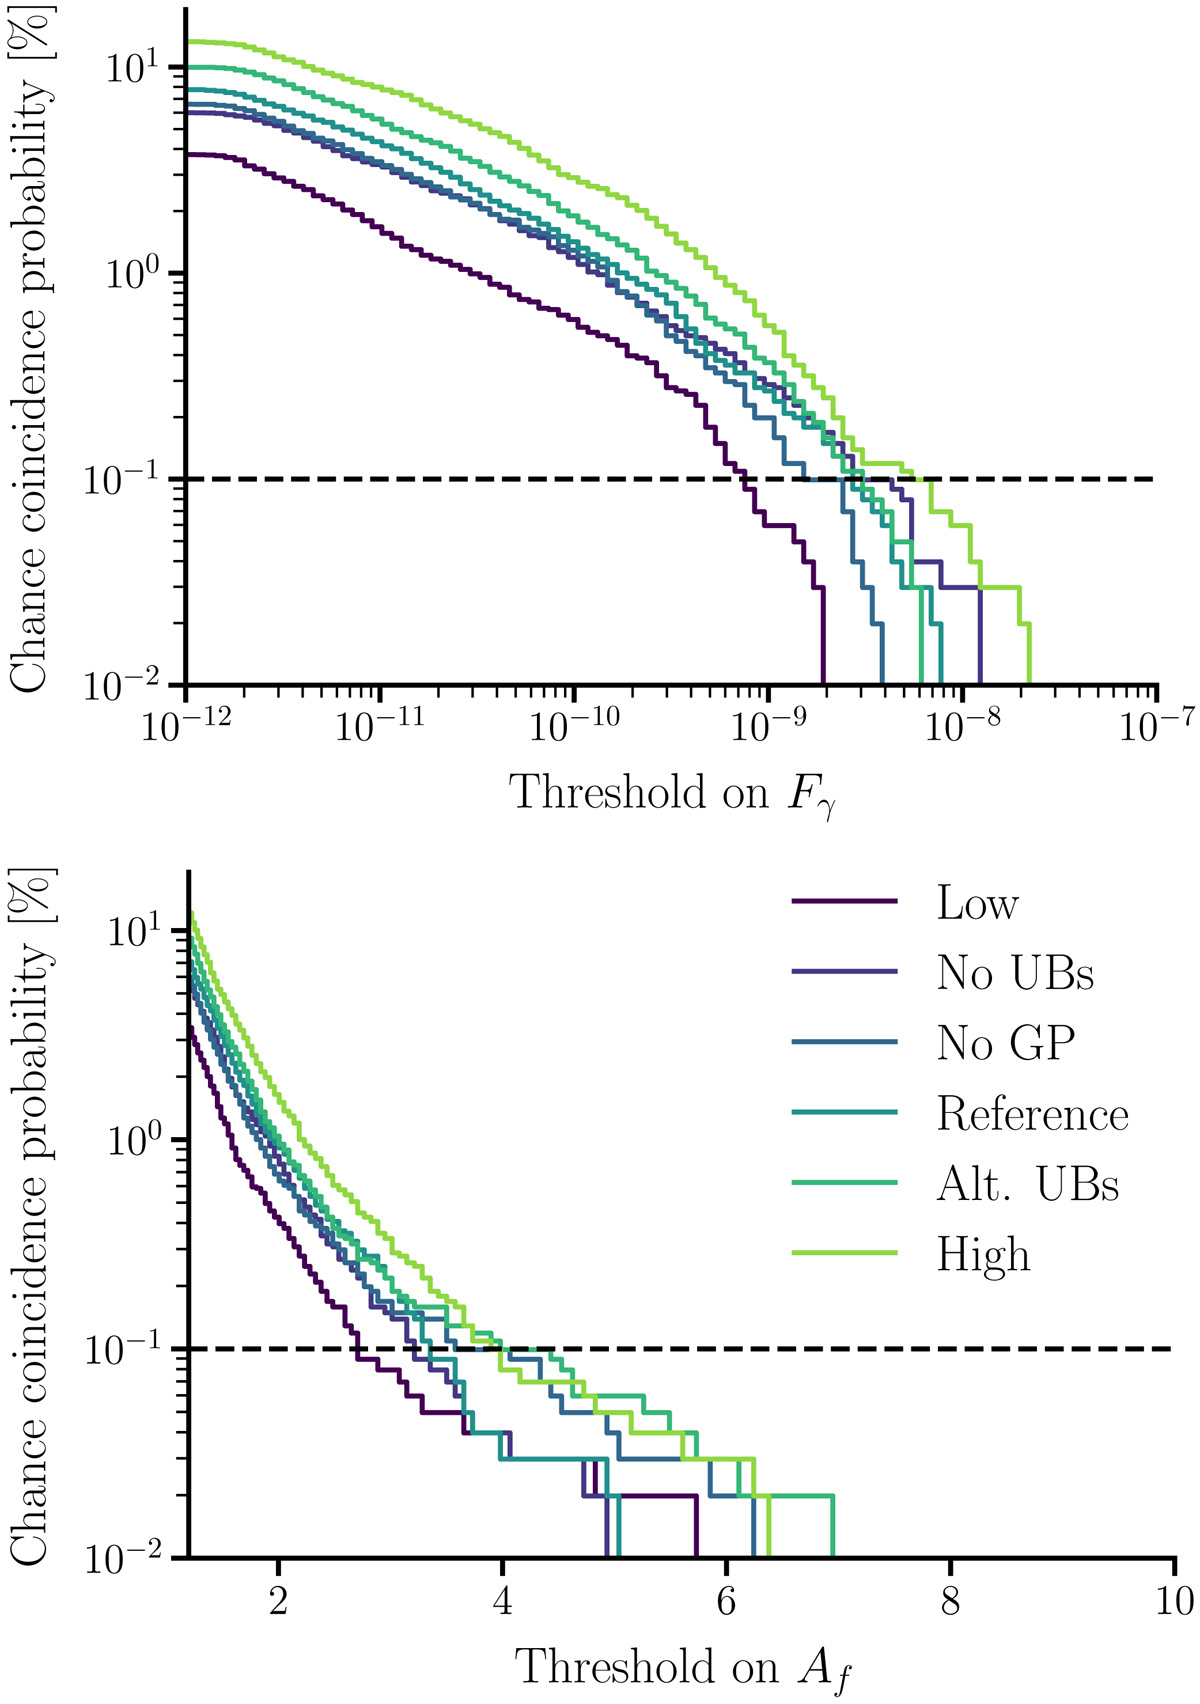
Chance coincidence probability as a function of the blazar flux (upper panel) and flare amplitude (lower panel) threshold. The different coloured lines show the different blazar population model assumptions, as in Fig. 5, and the dashed line at 0.1% gives the ∼3σ level.
Current usage metrics show cumulative count of Article Views (full-text article views including HTML views, PDF and ePub downloads, according to the available data) and Abstracts Views on Vision4Press platform.
Data correspond to usage on the plateform after 2015. The current usage metrics is available 48-96 hours after online publication and is updated daily on week days.
Initial download of the metrics may take a while.