Open Access
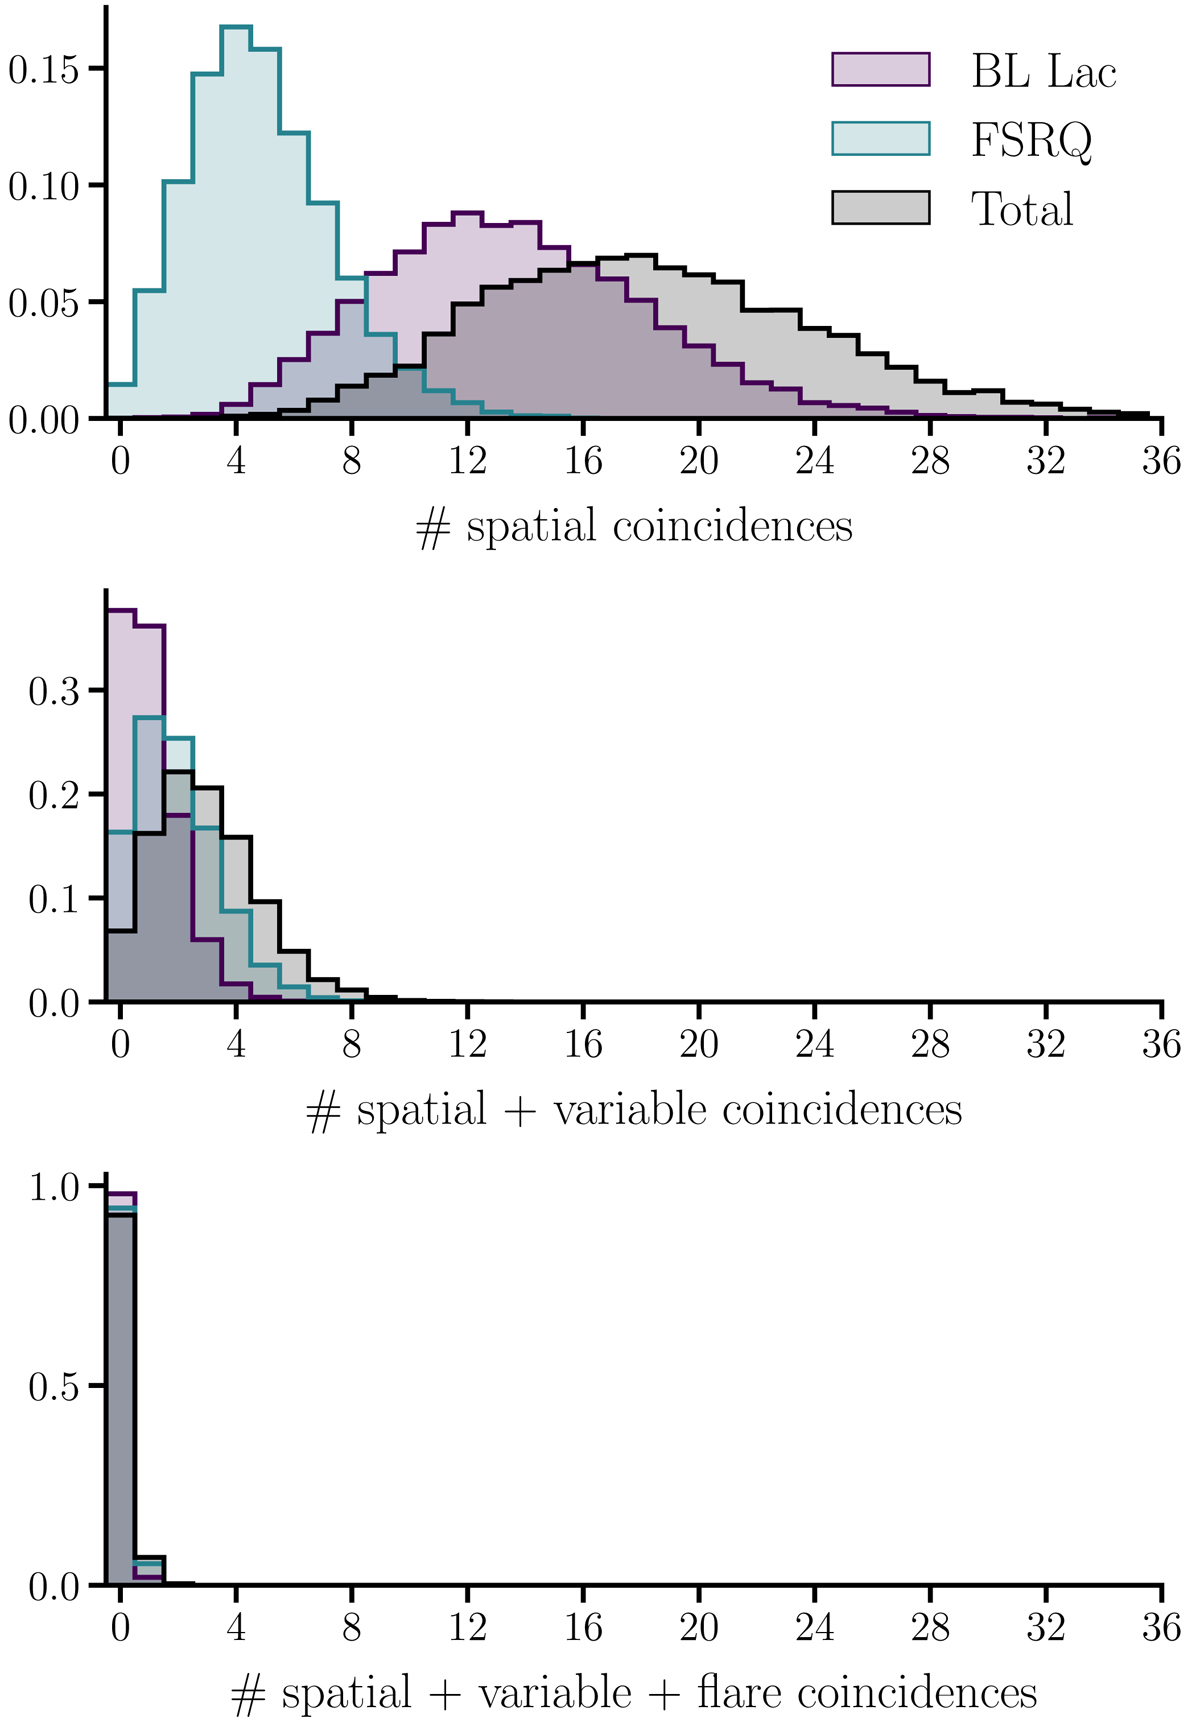
Fig. 4.
Download original image
Distributions of the number of coincidences for simulations of the reference model given in Appendix A. Three difference coincidence levels are shown, as explained in the text. The BL Lac and FSRQ survey results are shown in purple and blue, respectively, with the total combined blazar survey shown in black.
Current usage metrics show cumulative count of Article Views (full-text article views including HTML views, PDF and ePub downloads, according to the available data) and Abstracts Views on Vision4Press platform.
Data correspond to usage on the plateform after 2015. The current usage metrics is available 48-96 hours after online publication and is updated daily on week days.
Initial download of the metrics may take a while.