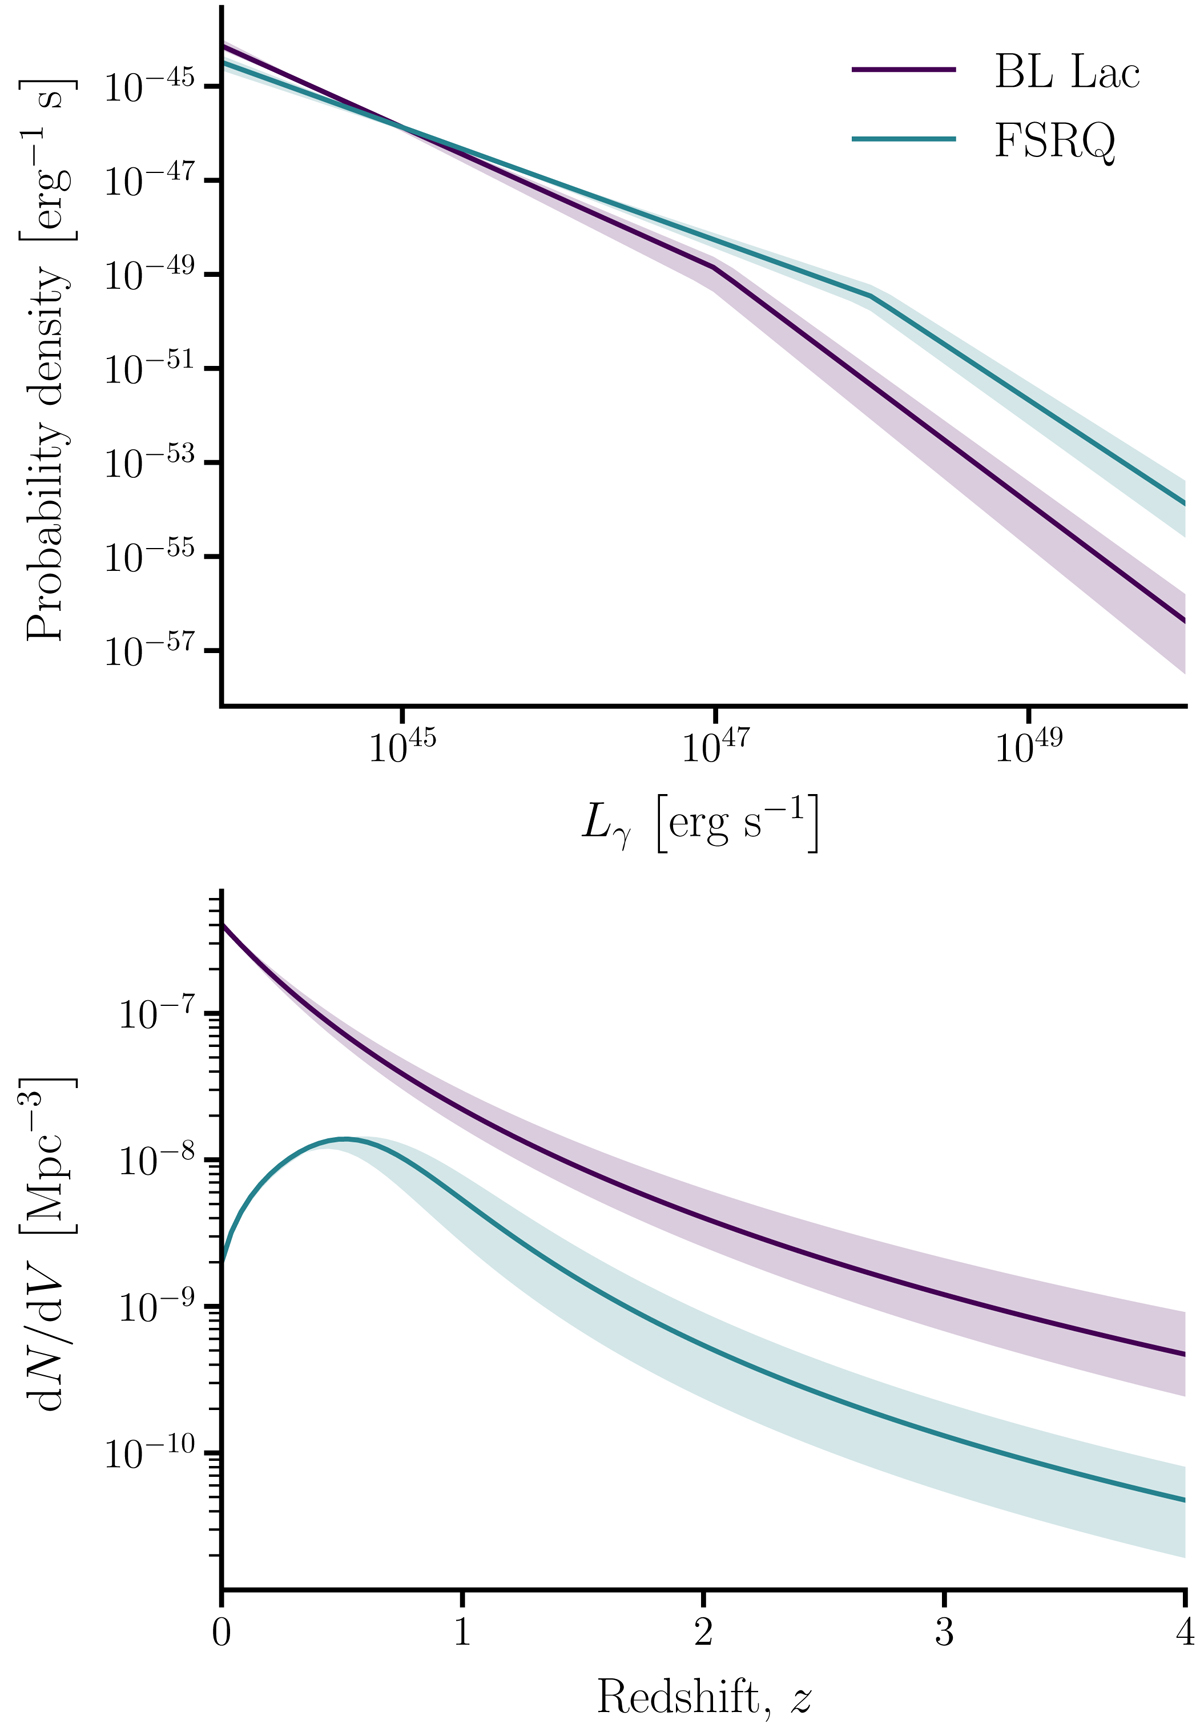
Fig. 2.
Download original image
Luminosity function (upper panel) and the source density evolution (lower panel) are shown for the range of blazar population models tested. The reference models are shown by solid curves, and the shaded regions indicate the bounds of the extreme models. The density evolution can be compared to Fig. 11 in Ajello et al. (2014), although their results are for a ‘luminosity-dependent density evolution’, and so should not be expected to be exactly the same as our simpler model.
Current usage metrics show cumulative count of Article Views (full-text article views including HTML views, PDF and ePub downloads, according to the available data) and Abstracts Views on Vision4Press platform.
Data correspond to usage on the plateform after 2015. The current usage metrics is available 48-96 hours after online publication and is updated daily on week days.
Initial download of the metrics may take a while.