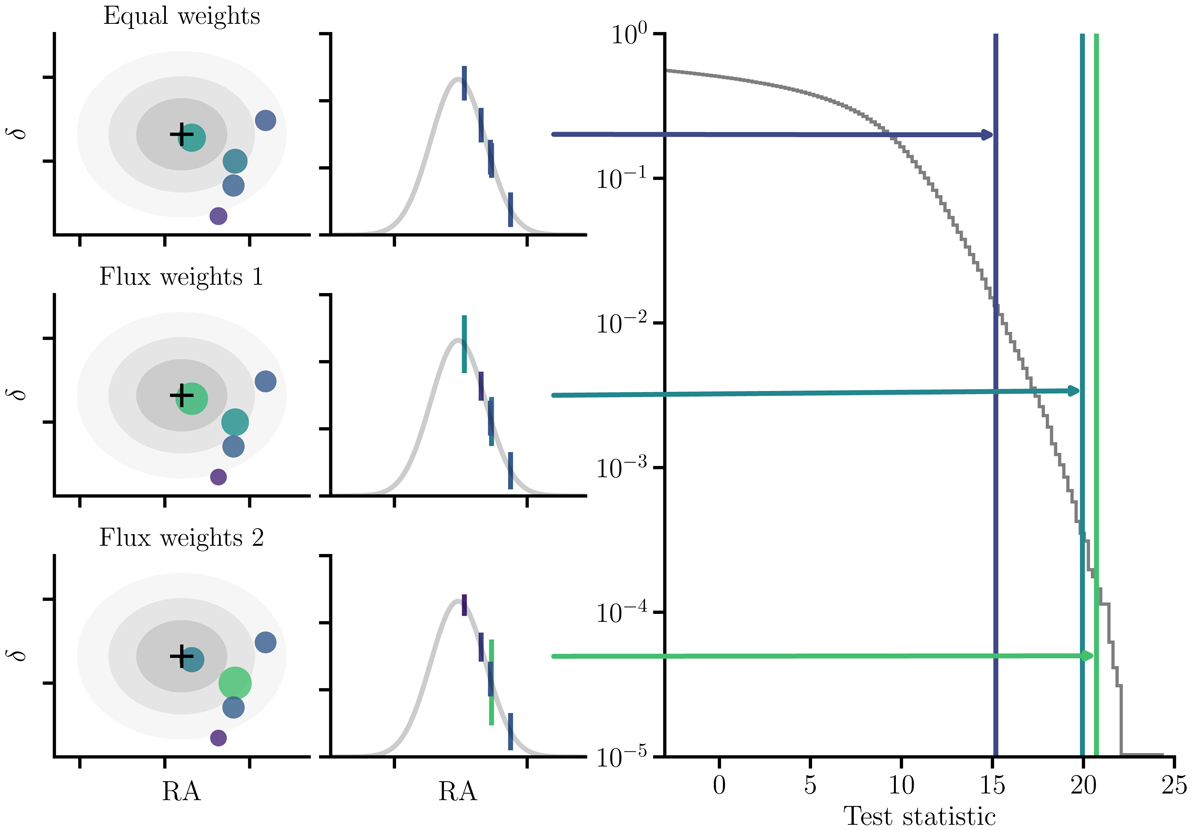
Fig. 1.
Download original image
Overview of the likelihood-ratio test analysis used in IC18. The left column shows a reconstructed neutrino direction and its angular uncertainty on the sky with a cross and grey contours, respectively. Nearby source directions are shown by the blue circles, with darker and larger markers representing their contribution to the 𝒮 term in Eq. (2). The centre column shows a 1D projection with the bars representing the flux weights, wi, model for each source. The right panel shows the inverse cumulative test statistic distribution in grey, with the test statistics calculated in each case indicated by the arrows. The weights of nearby sources strongly influence the test statistic value and that different scenarios can lead to significant results.
Current usage metrics show cumulative count of Article Views (full-text article views including HTML views, PDF and ePub downloads, according to the available data) and Abstracts Views on Vision4Press platform.
Data correspond to usage on the plateform after 2015. The current usage metrics is available 48-96 hours after online publication and is updated daily on week days.
Initial download of the metrics may take a while.