Open Access
Fig. 9
Download original image
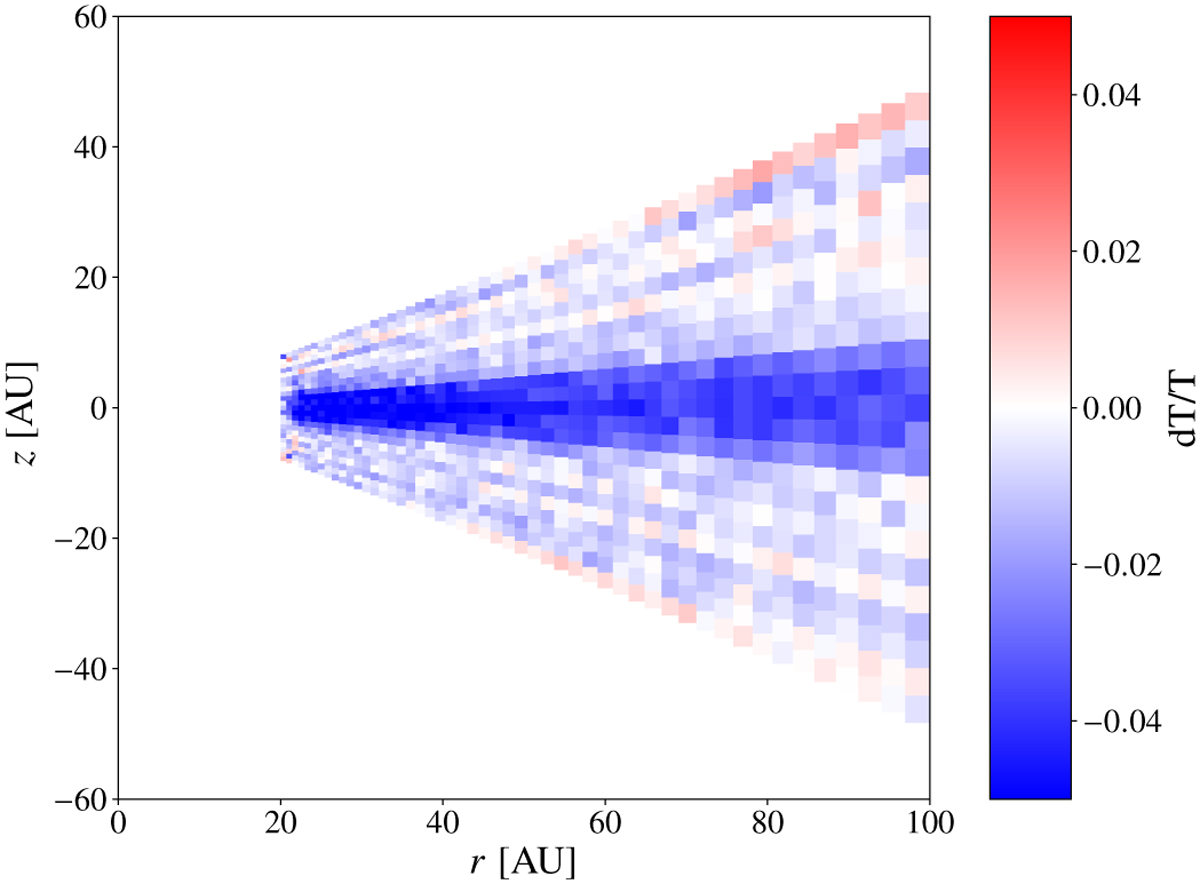
Difference plot of a vertical cut through the dust temperature distribution of the disk model with τ = 10 described in Sect. 4.1. The reference temperature distribution is calculated with the stationary method using 108 photon packages.
Current usage metrics show cumulative count of Article Views (full-text article views including HTML views, PDF and ePub downloads, according to the available data) and Abstracts Views on Vision4Press platform.
Data correspond to usage on the plateform after 2015. The current usage metrics is available 48-96 hours after online publication and is updated daily on week days.
Initial download of the metrics may take a while.