Fig. 3
Download original image
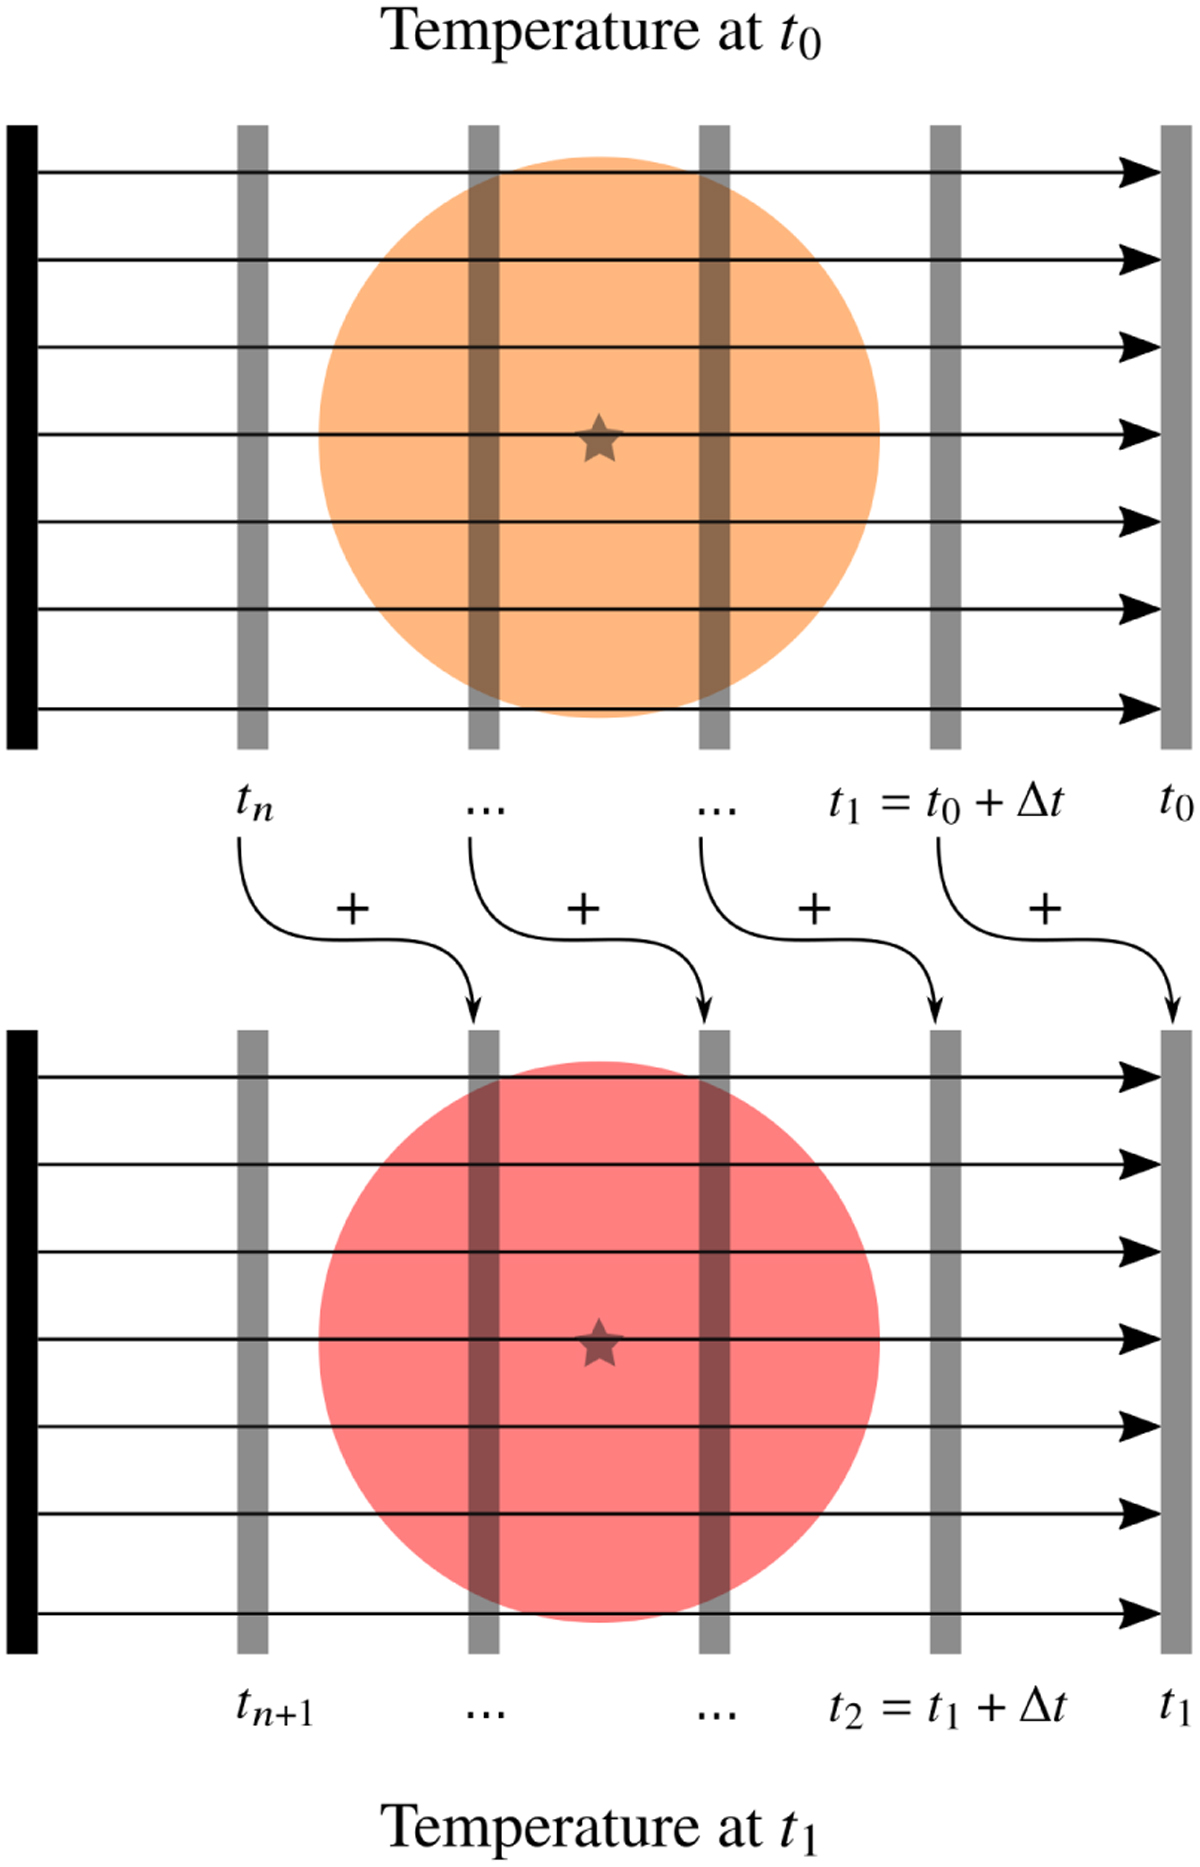
Sketch of the time-dependent ray tracing procedure for two different temperature distributions. The straight arrows denote the path of integration of each ray. The ray tracing simulation is performed based on the temperature distributions at time steps t0 and t1 separately. Detector images, i.e., images at the position of the observer obtained for the same time step are added up.
Current usage metrics show cumulative count of Article Views (full-text article views including HTML views, PDF and ePub downloads, according to the available data) and Abstracts Views on Vision4Press platform.
Data correspond to usage on the plateform after 2015. The current usage metrics is available 48-96 hours after online publication and is updated daily on week days.
Initial download of the metrics may take a while.