Fig. B.2
Download original image
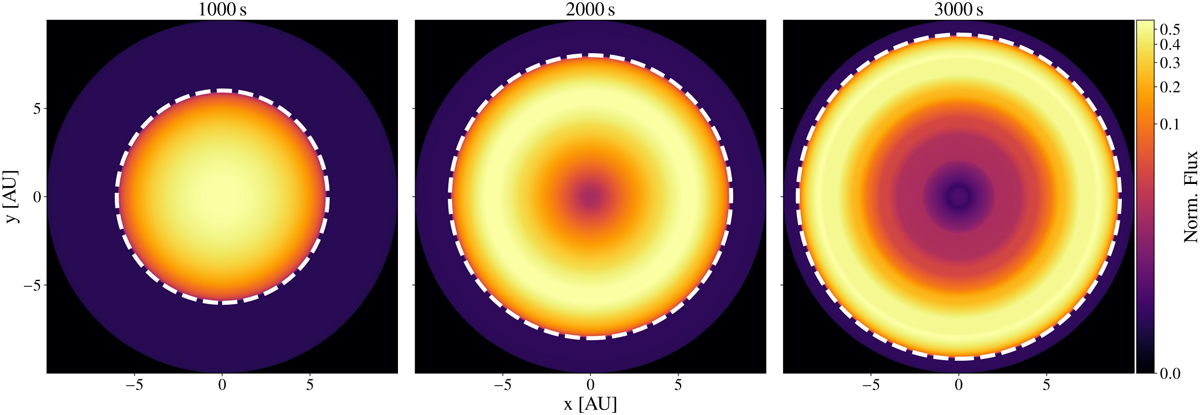
Images of the thermal reemission radiation of the dust shell outburst model after 1000, 2000 and 3000 s at a wavelength of 10 µm as described in Sect. B (temporal step width: 1000 s). The flux is normalized with respect to the maximum flux of the image after 1 000 s. The white dotted lines indicate the maximum radius of the parabola depicted in Fig. B.1.
Current usage metrics show cumulative count of Article Views (full-text article views including HTML views, PDF and ePub downloads, according to the available data) and Abstracts Views on Vision4Press platform.
Data correspond to usage on the plateform after 2015. The current usage metrics is available 48-96 hours after online publication and is updated daily on week days.
Initial download of the metrics may take a while.