Open Access
Fig. B.1
Download original image
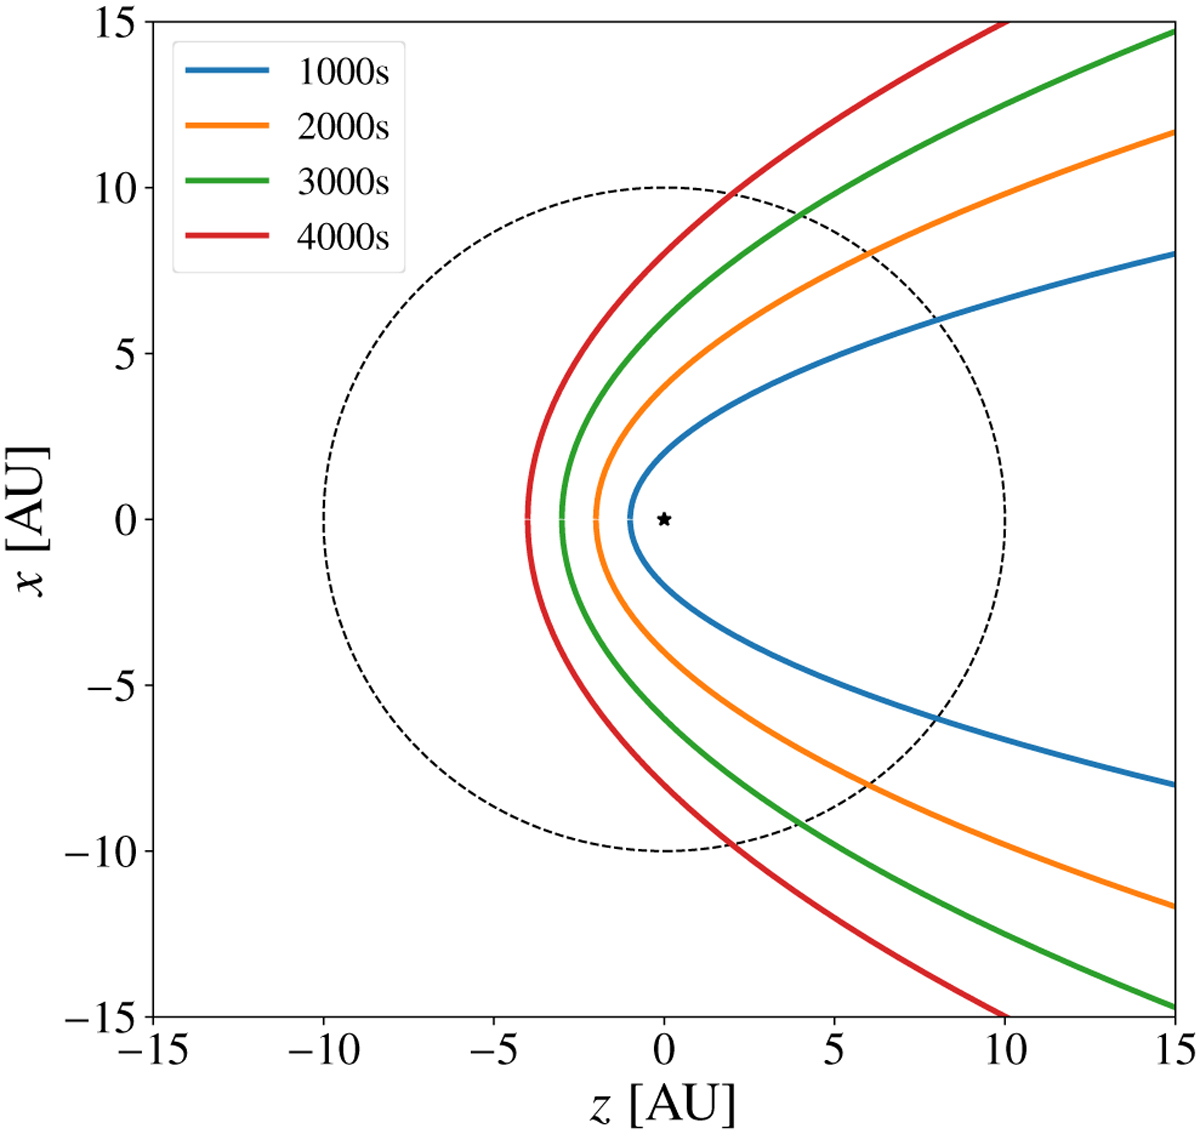
Dust shell outburst model: Regions of dust reemission radiation seen by an observer for different time steps after an outburst for the model described in Sect. B calculated using Eq. B.1. The dashed line indicates the outer radius of the dust distribution. The position of the central source is indicated by an asterisk.
Current usage metrics show cumulative count of Article Views (full-text article views including HTML views, PDF and ePub downloads, according to the available data) and Abstracts Views on Vision4Press platform.
Data correspond to usage on the plateform after 2015. The current usage metrics is available 48-96 hours after online publication and is updated daily on week days.
Initial download of the metrics may take a while.