Fig. 16
Download original image
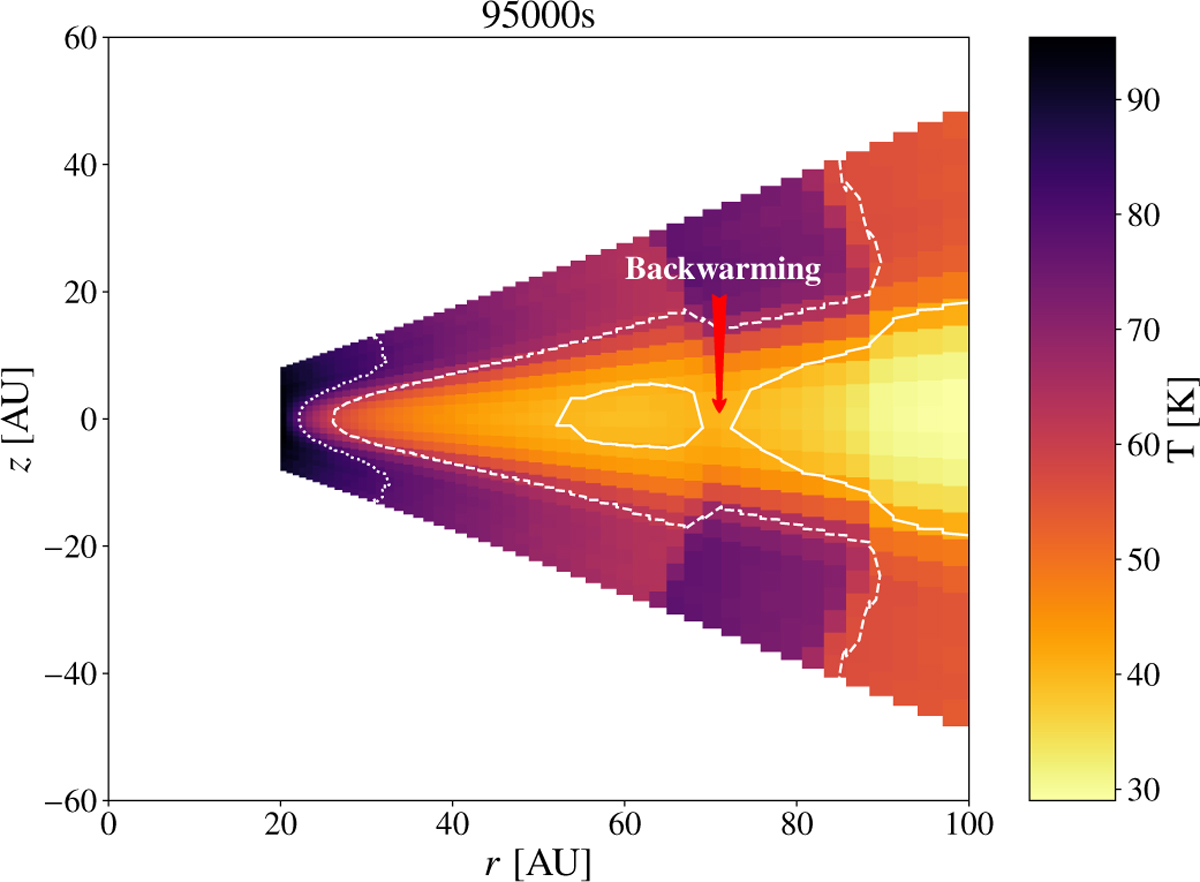
Vertical cut through the temperature distribution of the outburst disk model with high optical depth after 95 000 s described in Sect. 4.3. The temporal step width of the simulation is set to 4s: 105 photon package are emitted per time step. The contour lines mark three levels of temperatures. The red arrow outlines a region in which the backwarming effect can be seen.
Current usage metrics show cumulative count of Article Views (full-text article views including HTML views, PDF and ePub downloads, according to the available data) and Abstracts Views on Vision4Press platform.
Data correspond to usage on the plateform after 2015. The current usage metrics is available 48-96 hours after online publication and is updated daily on week days.
Initial download of the metrics may take a while.