Open Access
Fig. 10
Download original image
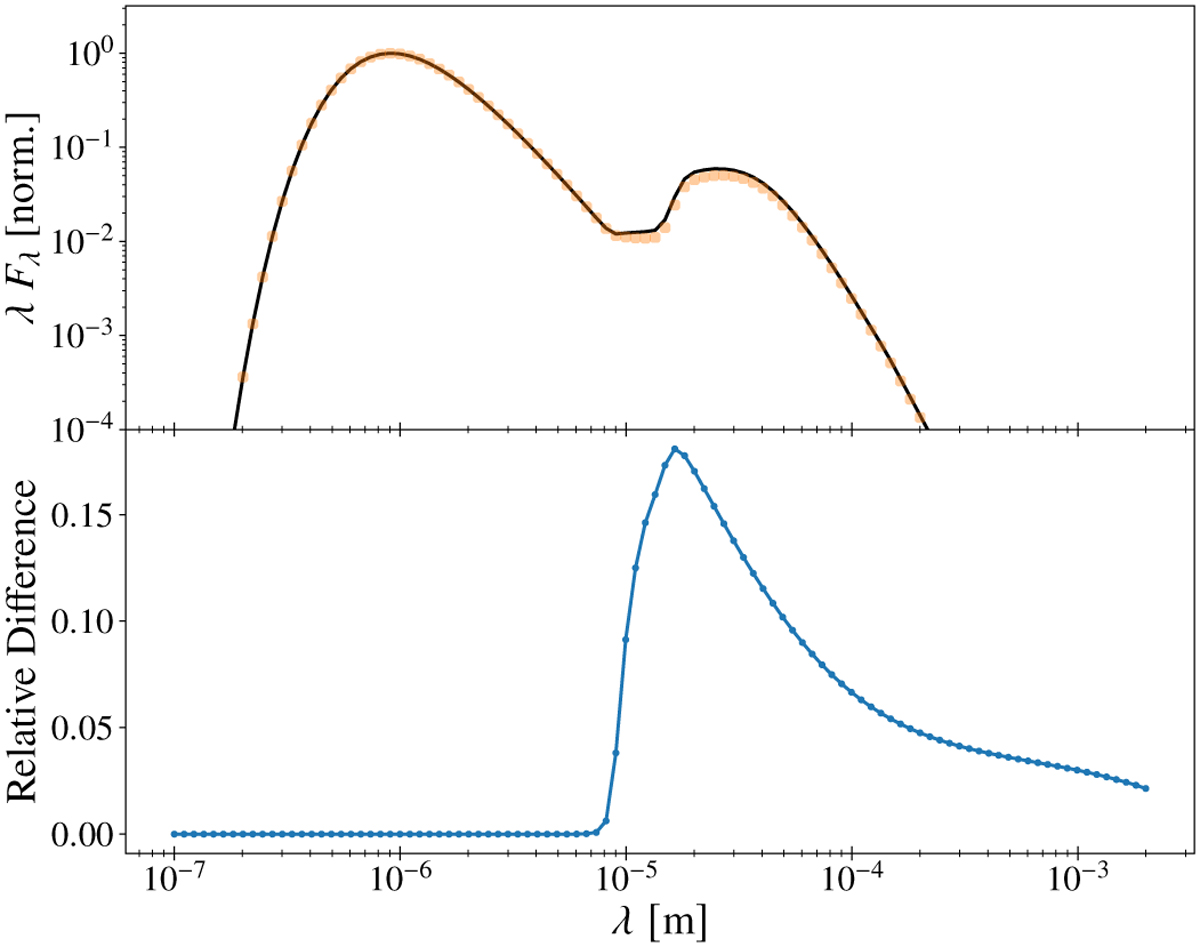
Normalized SED (top) and relative difference (bottom) of the time-dependent temperature distribution of the disk model with τ = 10 discussed in Sect. 4.1 (dotted). The reference SED (solid) is calculated using the temperature distribution of the stationary method.
Current usage metrics show cumulative count of Article Views (full-text article views including HTML views, PDF and ePub downloads, according to the available data) and Abstracts Views on Vision4Press platform.
Data correspond to usage on the plateform after 2015. The current usage metrics is available 48-96 hours after online publication and is updated daily on week days.
Initial download of the metrics may take a while.