Open Access
Fig. 8.
Download original image
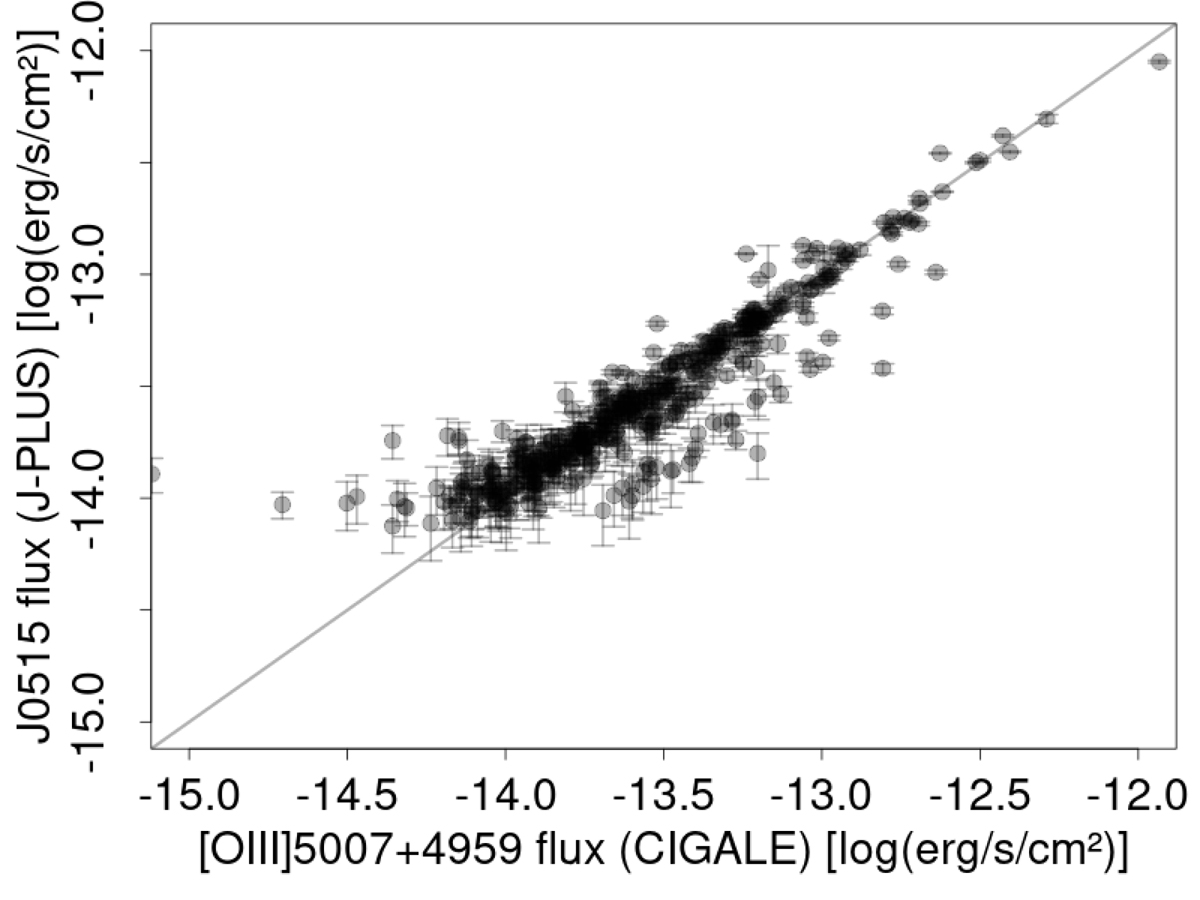
Comparison between the emission line flux measured in the J0515 filter and the [OIII]5007+4959 flux estimated by the CIGALE SED fit for the EELG sample. The black line represents the one-to-one relation.
Current usage metrics show cumulative count of Article Views (full-text article views including HTML views, PDF and ePub downloads, according to the available data) and Abstracts Views on Vision4Press platform.
Data correspond to usage on the plateform after 2015. The current usage metrics is available 48-96 hours after online publication and is updated daily on week days.
Initial download of the metrics may take a while.