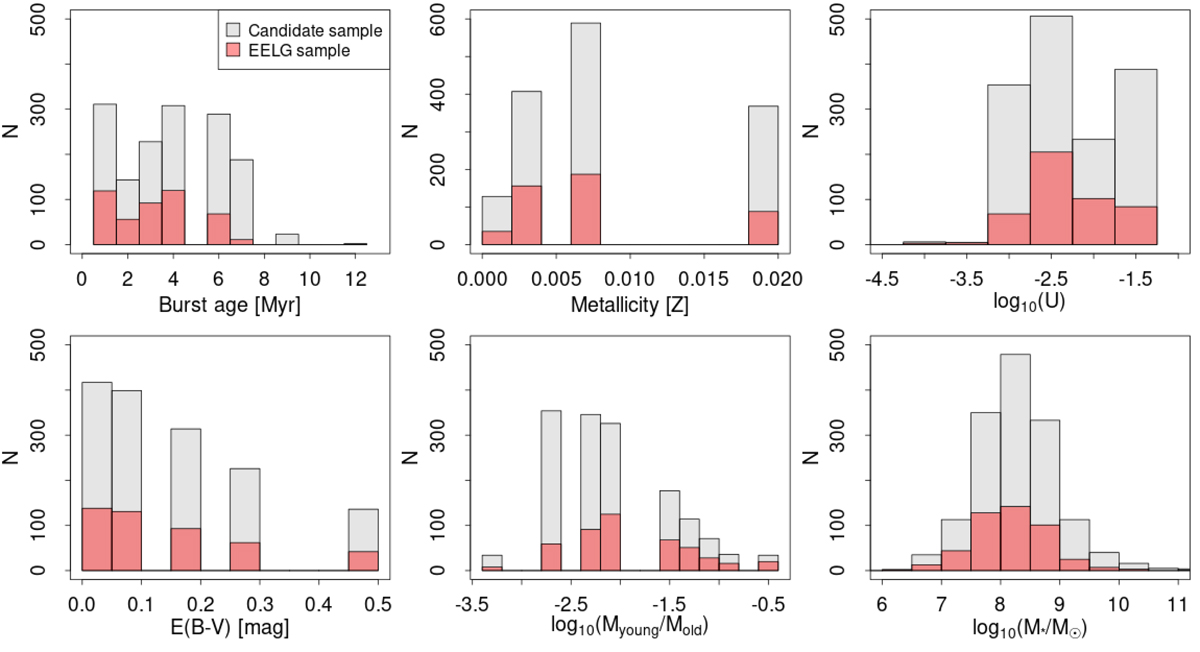
Fig. 6.
Download original image
Histograms showing the best-fitting values for the J-PLUS galaxies, derived using the SED fitting software CIGALE. We show in gray the results for the 1493 galaxies in the candidate sample and in red the 466 galaxies in the EELG sample (EW[OIII] > 300 Å). From left to right and top to bottom: we show the age of the young population, the stellar metallicity, the ionization parameter, the color excess, the mass ratio of young and old populations, and the total stellar mass. The gaps observed in some of the histograms are due to the sampling in the parameters (see Table 2 and Appendix C).
Current usage metrics show cumulative count of Article Views (full-text article views including HTML views, PDF and ePub downloads, according to the available data) and Abstracts Views on Vision4Press platform.
Data correspond to usage on the plateform after 2015. The current usage metrics is available 48-96 hours after online publication and is updated daily on week days.
Initial download of the metrics may take a while.