Fig. 5.
Download original image
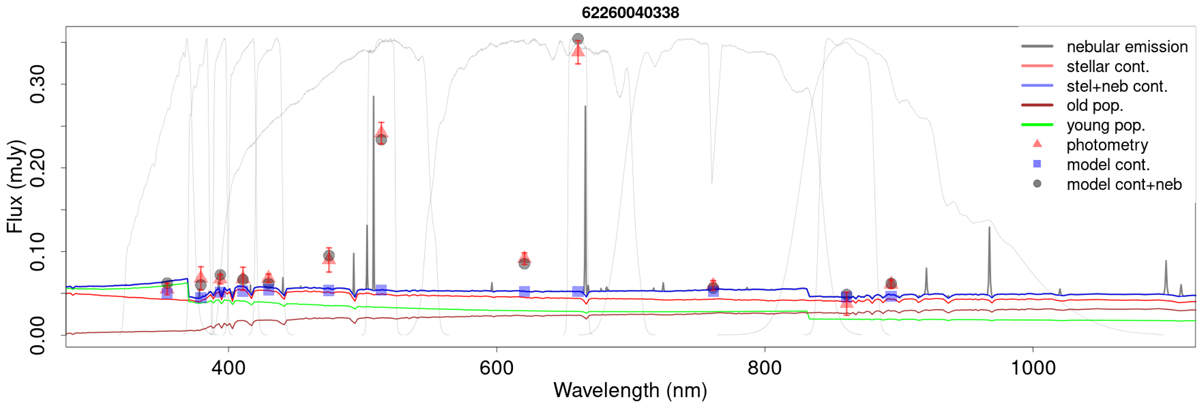
Example of the J-PLUS SED and CIGALE fit of an EELG. Red triangles correspond to the observed photometry, grey dots to the CIGALE synthetic photometry, and blue squares to the CIGALE synthetic photometry only considering the stellar and nebular continua (not considering the emission lines). The thick lines represent the CIGALE synthetic spectrum, considering different components: the grey line takes into account the full model, while the blue does not take into account the emission lines. The red line represents the stellar continuum, while the brown and green only consider the old and young stellar populations, respectively. The thin grey lines in the background represent the transmission profiles of all 12 J-PLUS filters.
Current usage metrics show cumulative count of Article Views (full-text article views including HTML views, PDF and ePub downloads, according to the available data) and Abstracts Views on Vision4Press platform.
Data correspond to usage on the plateform after 2015. The current usage metrics is available 48-96 hours after online publication and is updated daily on week days.
Initial download of the metrics may take a while.