Fig. 4.
Download original image
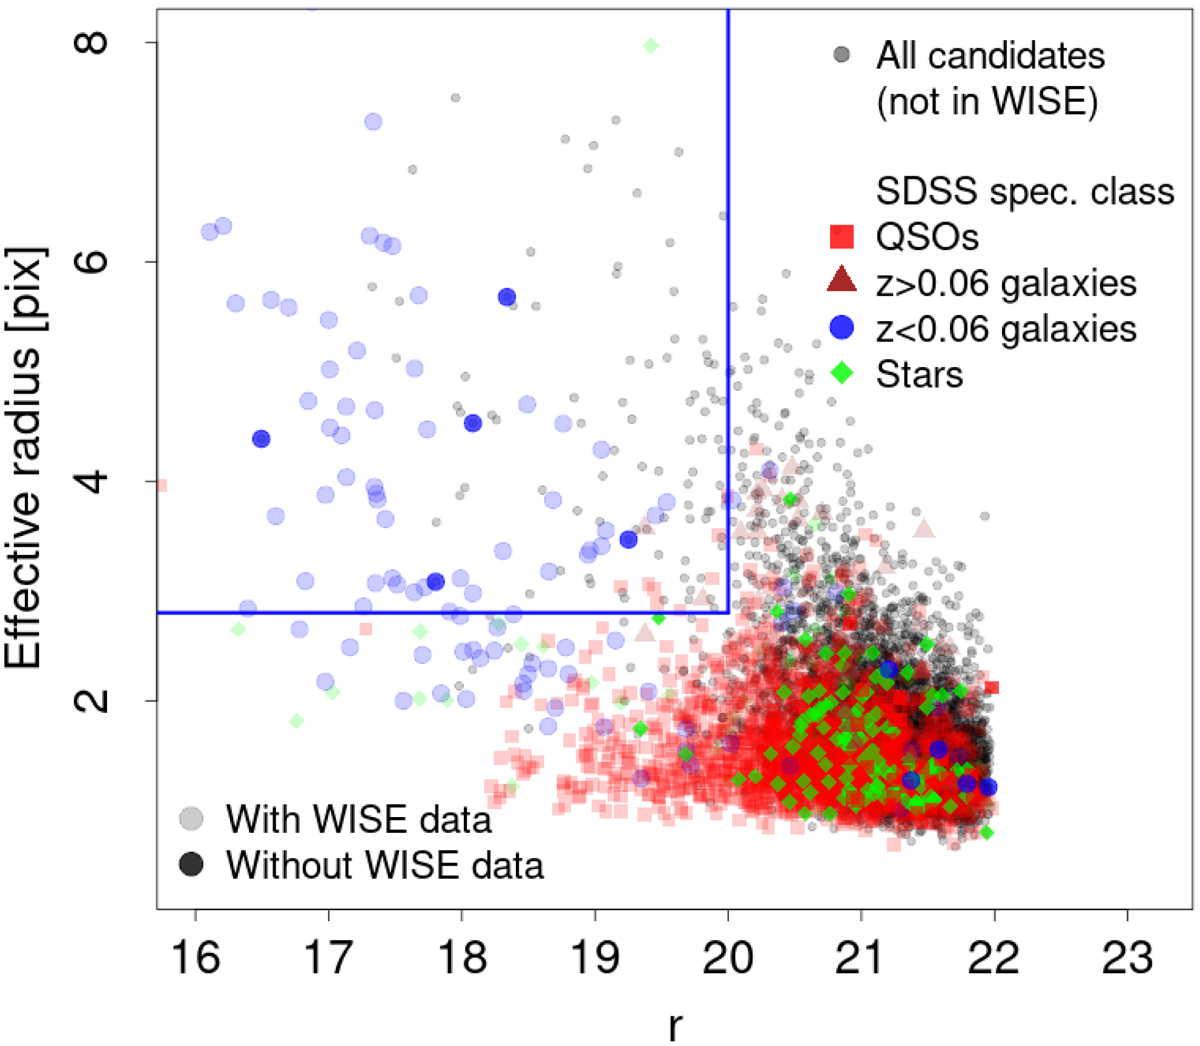
Diagram showing the effective radius as a function of r magnitude, used to select candidates to be EELGs for those objects with excess flux in J0515 and no data in the unWISE catalog (grey dots). All sources with SDSS spectra are shown in colors. The color code for those is the same as the one used in Fig. 2, but in this case objects with W1 data are shown in a lighter shade.
Current usage metrics show cumulative count of Article Views (full-text article views including HTML views, PDF and ePub downloads, according to the available data) and Abstracts Views on Vision4Press platform.
Data correspond to usage on the plateform after 2015. The current usage metrics is available 48-96 hours after online publication and is updated daily on week days.
Initial download of the metrics may take a while.