Fig. 3.
Download original image
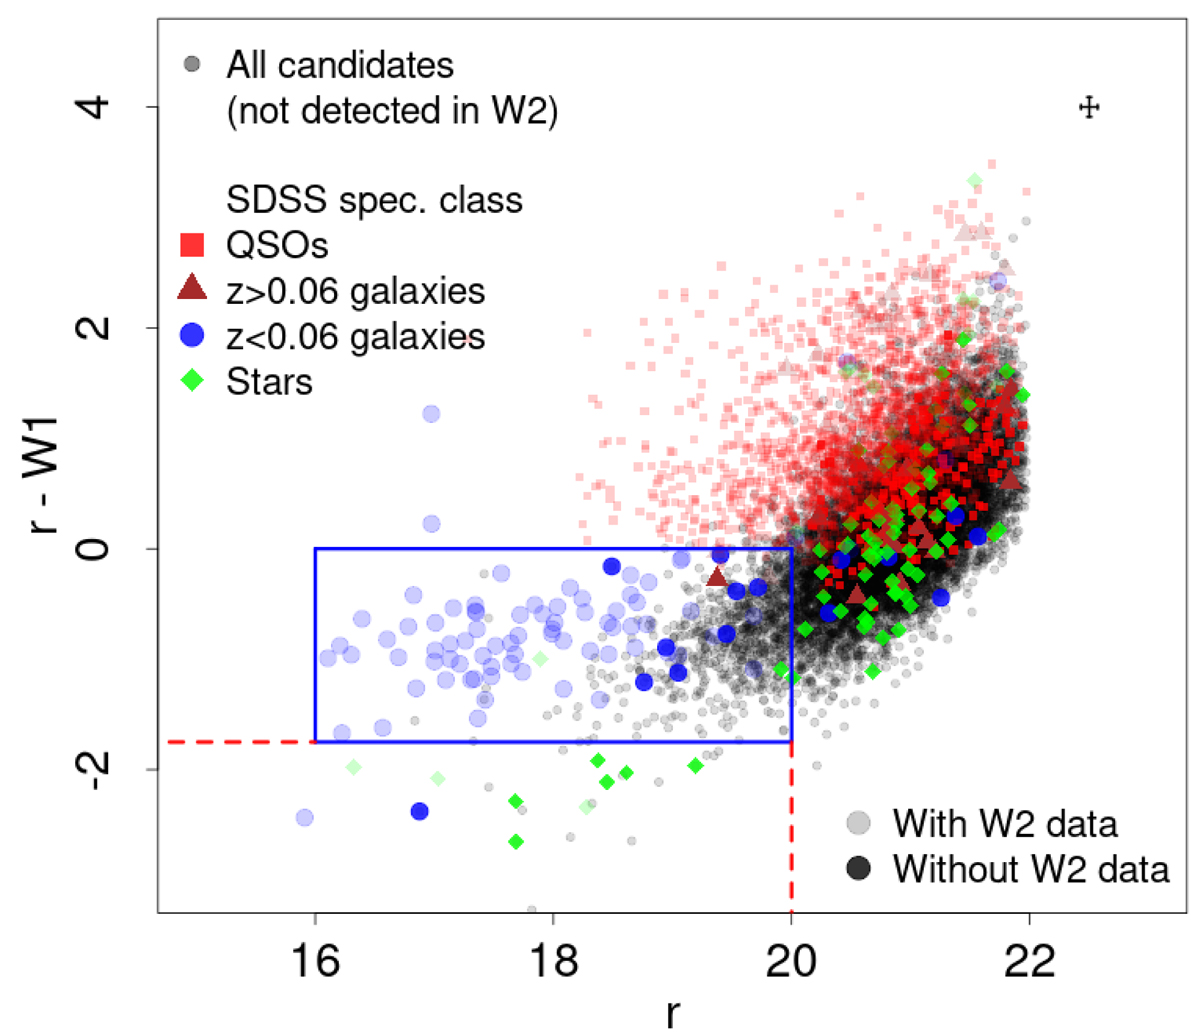
Color-magnitude diagram used to separate low redshift ELGs from other types of sources, for those objects where the W2 flux was not available (grey dots). All sources with SDSS spectra are shown in colors. The color code for those is the same as the one used in Fig. 2, but in this case objects with available W2 measurements are shown in a lighter shade. The objects selected as candidates to be EELGs are enclosed by the blue lines, while those to the left of the dashed red line are visually inspected to select only the extended ones as EELGs. Top right corner: typical errors (for sources with r < 20 mag) are shown.
Current usage metrics show cumulative count of Article Views (full-text article views including HTML views, PDF and ePub downloads, according to the available data) and Abstracts Views on Vision4Press platform.
Data correspond to usage on the plateform after 2015. The current usage metrics is available 48-96 hours after online publication and is updated daily on week days.
Initial download of the metrics may take a while.