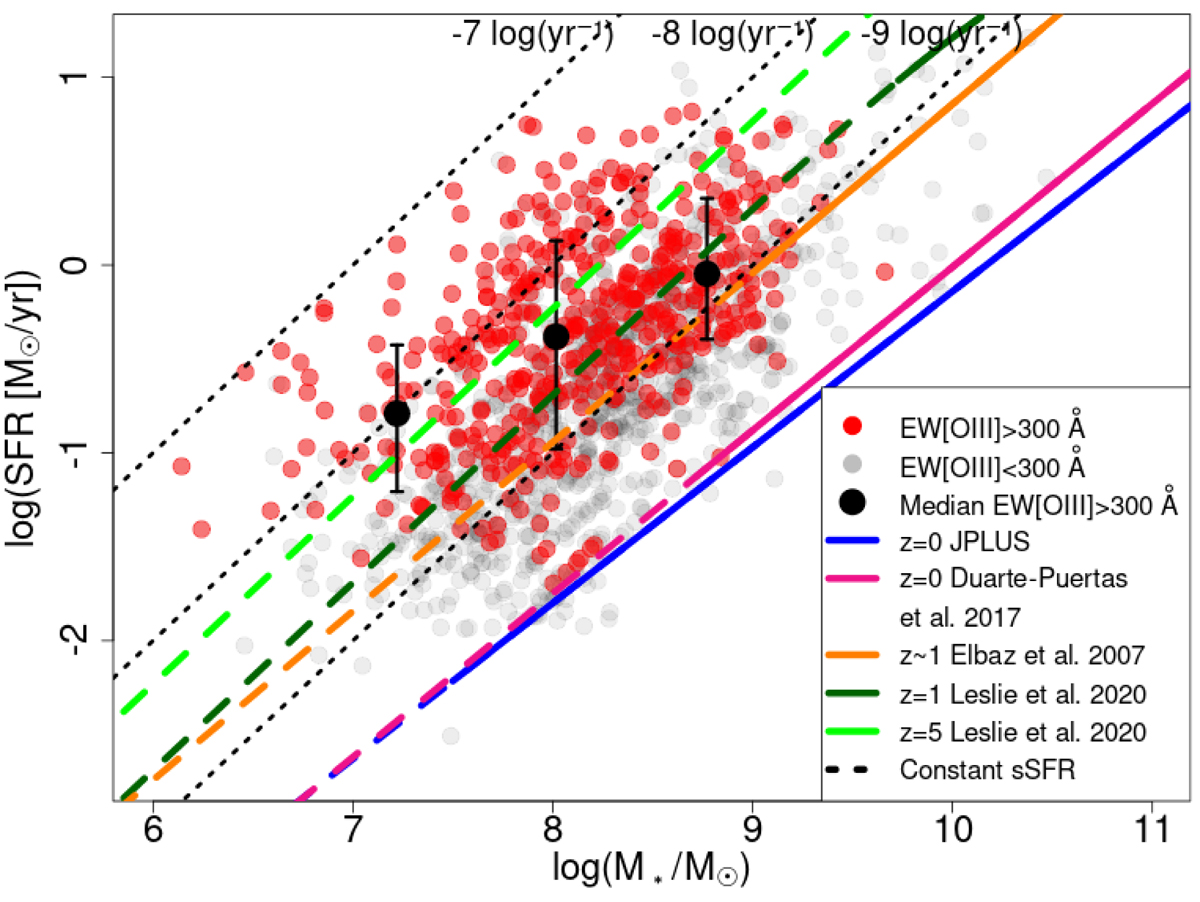
Fig. 20.
Download original image
SFR as a function of stellar mass for the galaxies in the EELG sample (red dots) and the rest of the candidate sample (gray dots). Large black dots represent the median values for the EELG sample grouped into mass bins. Colored lines represent main-sequence fits from the literature: Vilella-Rojo et al. (2021) in blue, Duarte Puertas et al. (2017) in red, Elbaz et al. (2007) in orange, and Leslie et al. (2020) in black (z ∼ 1) and green (z ∼ 5). Dashed and continuous lines follow the prescription in Fig. 19. Dotted black lines represent constant sSFR.
Current usage metrics show cumulative count of Article Views (full-text article views including HTML views, PDF and ePub downloads, according to the available data) and Abstracts Views on Vision4Press platform.
Data correspond to usage on the plateform after 2015. The current usage metrics is available 48-96 hours after online publication and is updated daily on week days.
Initial download of the metrics may take a while.