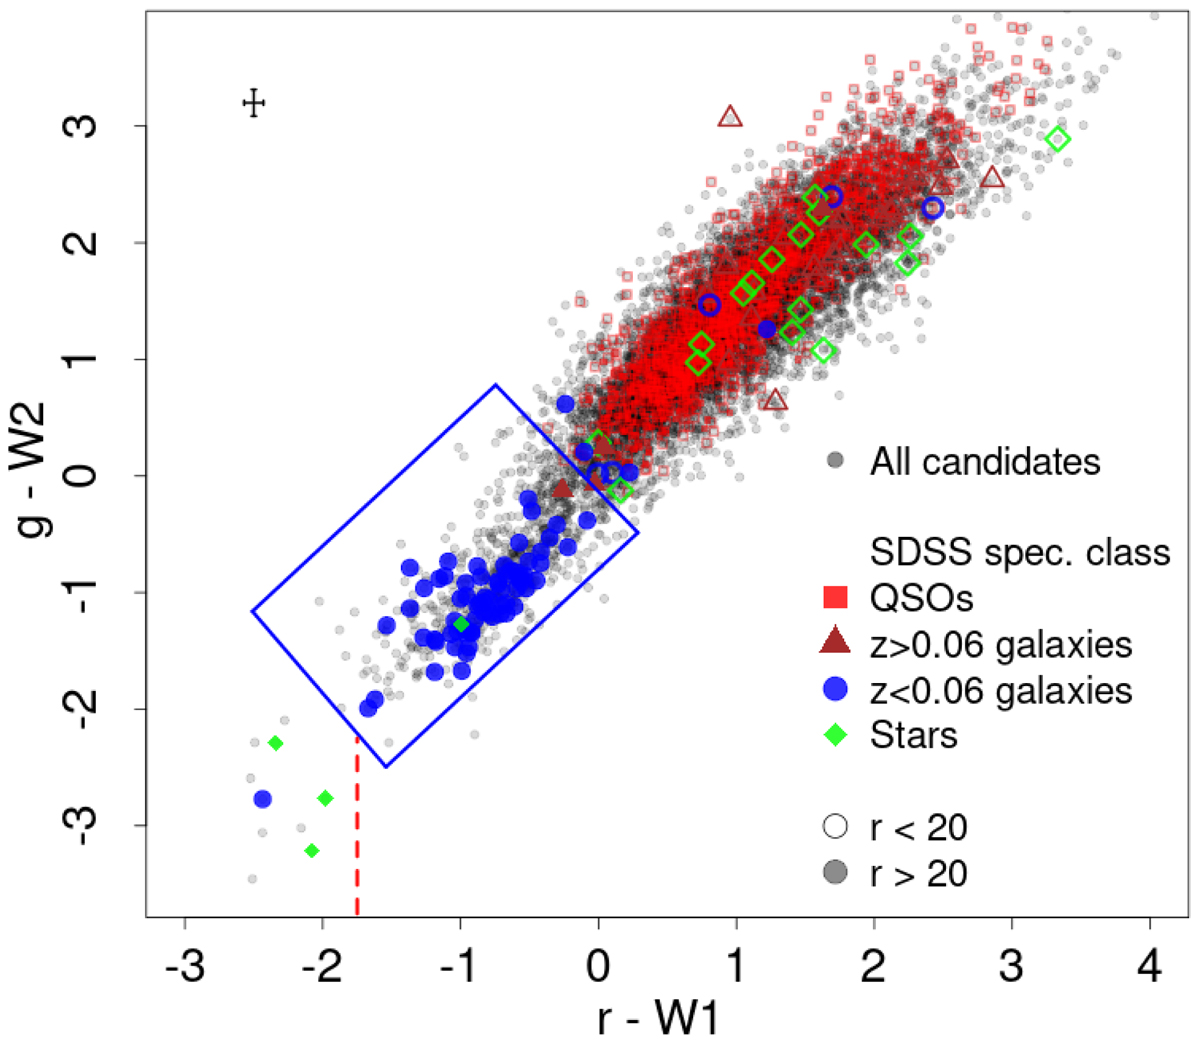
Fig. 2.
Download original image
Color-color diagram used to separate low redshift ELGs from other types of sources. The g and r data are taken from J-PLUS DR2, and the W1 and W2 from the unWISE catalog. All candidates from the sample with J0515 excess flux are shown in dark grey dots. Sources with SDSS spectra are shown in colors according to their nature: red squares for QSOs, blue circles for galaxies at z < 0.06, brown triangles for galaxies at z > = 0.06, and green diamonds for stars. Filled symbols (or outlines only) are used if the sources are brighter (fainter) than r = 20 mag. The objects selected as candidates to be EELGs are enclosed by the blue lines, while those to the left of the dashed red line are visually inspected to select only the extended ones as EELGs. Top left corner: the typical errors (for sources with r < 20 mag) are shown.
Current usage metrics show cumulative count of Article Views (full-text article views including HTML views, PDF and ePub downloads, according to the available data) and Abstracts Views on Vision4Press platform.
Data correspond to usage on the plateform after 2015. The current usage metrics is available 48-96 hours after online publication and is updated daily on week days.
Initial download of the metrics may take a while.