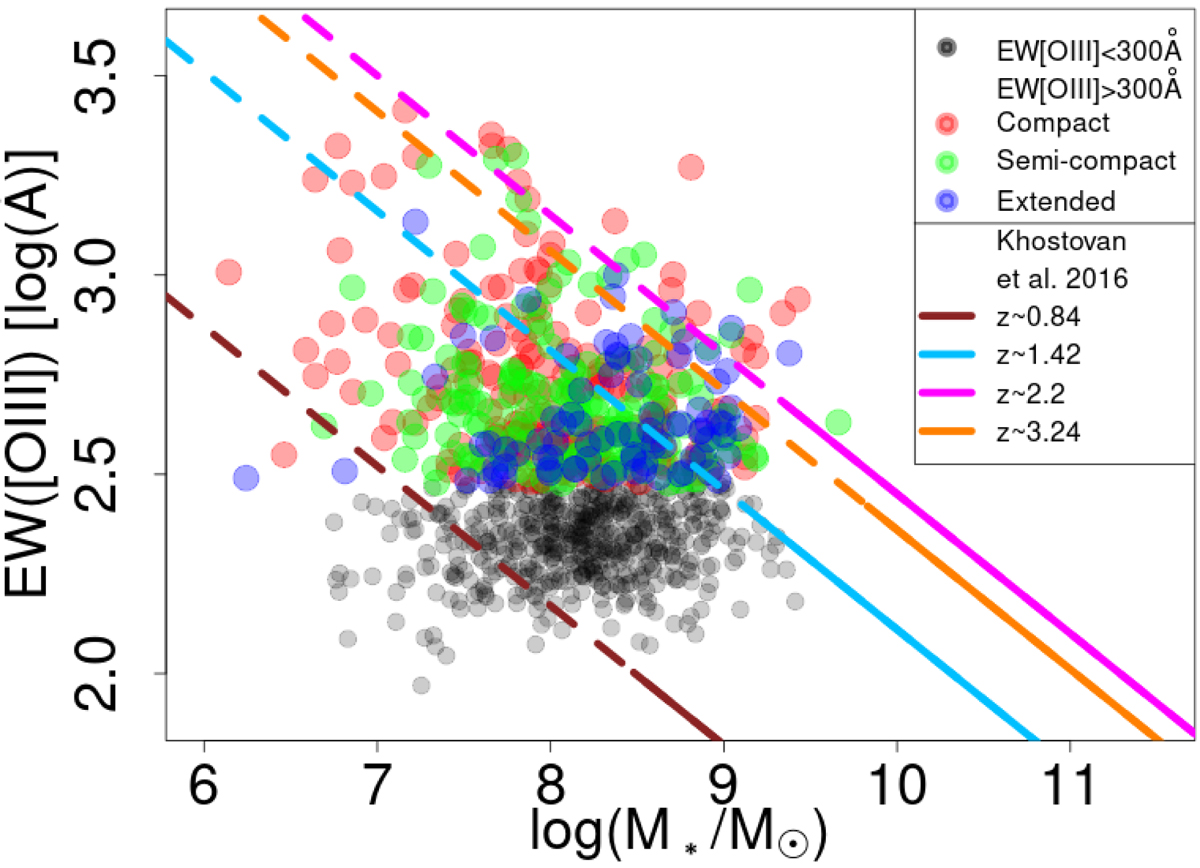
Fig. 19.
Download original image
[OIII] EW of the EELG (color dots) and candidate (gray dots) samples as a function of stellar mass. We plot the galaxies in the EELG sample according to their morphology in different colors: red corresponds to compact, green to semicompact, and blue to extended objects. In addition, we overplot linear relations from Khostovan et al. (2016) at different redshifts (black at z ∼ 0.84, blue at z ∼ 1.42, pink at z ∼ 2, and orange at z ∼ 3.24). The linear relations are plotted in as continuous lines in the mass ranges in which they were defined, and as dashed lines in their extensions to lower masses.
Current usage metrics show cumulative count of Article Views (full-text article views including HTML views, PDF and ePub downloads, according to the available data) and Abstracts Views on Vision4Press platform.
Data correspond to usage on the plateform after 2015. The current usage metrics is available 48-96 hours after online publication and is updated daily on week days.
Initial download of the metrics may take a while.