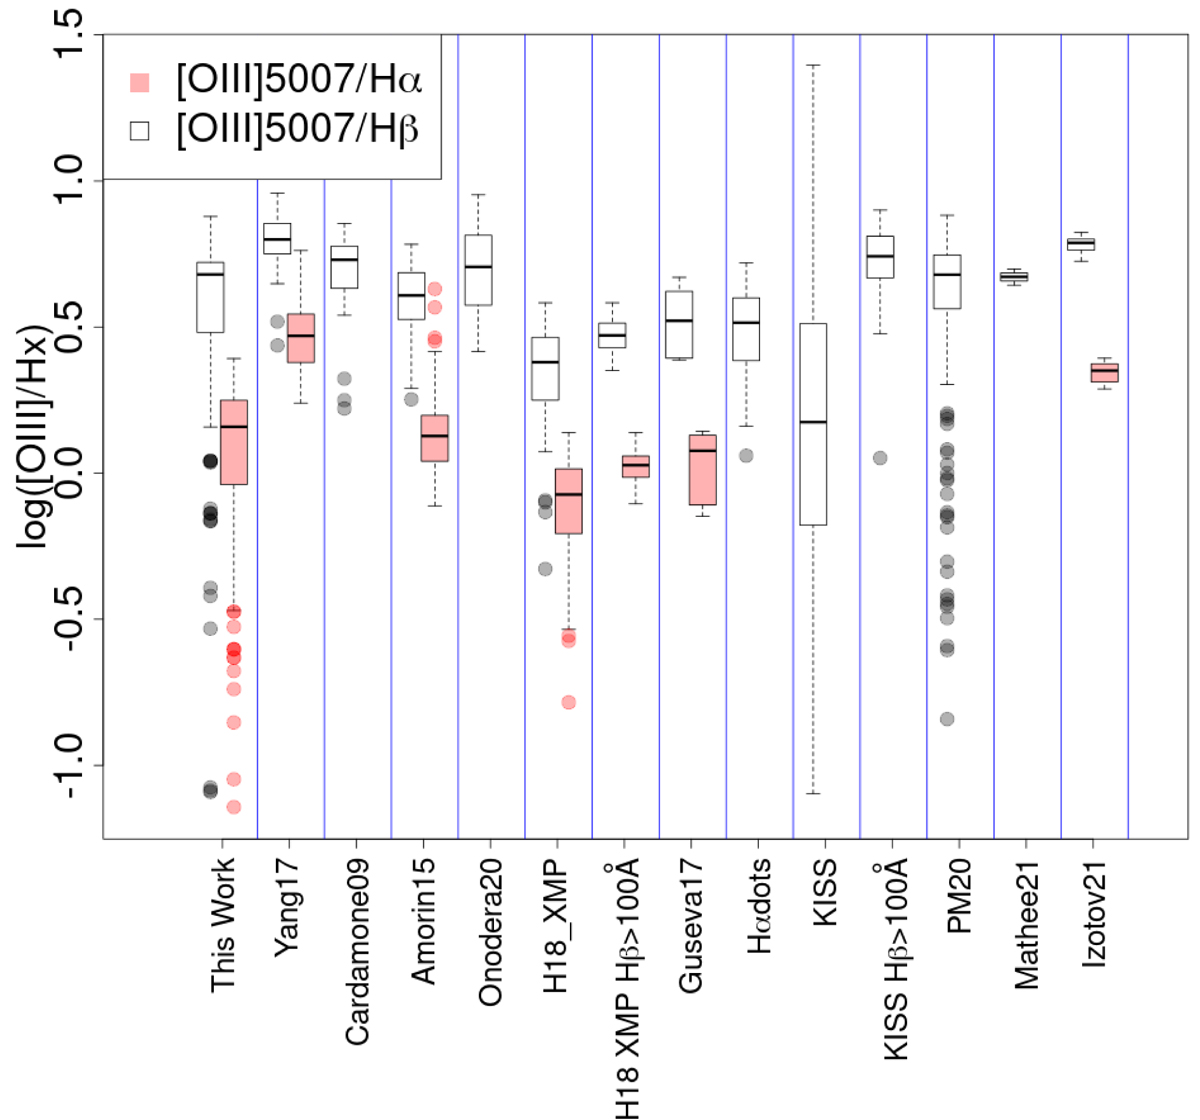
Fig. 18.
Download original image
Distribution of the ratios [OIII]5007/Hα (filled red rectangles and dots) and [OIII]5007/Hβ (filled white rectangles and gray dots). The thick black line represents the median value, and the box ranges from the first to the third quartile. The error bars represent the maximum and minimum value without outliers, which are plotted as dots (and defined as the values that lie beyond 1.5 times the interquartilic range). We plot in this figure results from our work and several samples from the literature (Yang et al. 2017; Cardamone et al. 2009; Amorín et al. 2015; Onodera et al. 2020; Hsyu et al. 2018; Guseva et al. 2017; Pérez-Montero et al. 2020; Matthee et al. 2021; Izotov et al. 2021), as well as the KISS survey (Wegner et al. 2003; Gronwall et al. 2004; Jangren et al. 2005; Salzer et al. 2005) and the Hα dots class (Kellar et al. 2012; Salzer et al. 2020). We selected the subsample with extremely low metallicity in Hsyu et al. (2018) (H18_XMP), as well as galaxies with EW(Hβ) > 100 Å in both Hsyu et al. (2018) XMPs (H18_XMP Hβ > 100 Å) and the KISS survey (KISS Hβ > 100 Å). Different samples are separated by vertical blue lines.
Current usage metrics show cumulative count of Article Views (full-text article views including HTML views, PDF and ePub downloads, according to the available data) and Abstracts Views on Vision4Press platform.
Data correspond to usage on the plateform after 2015. The current usage metrics is available 48-96 hours after online publication and is updated daily on week days.
Initial download of the metrics may take a while.