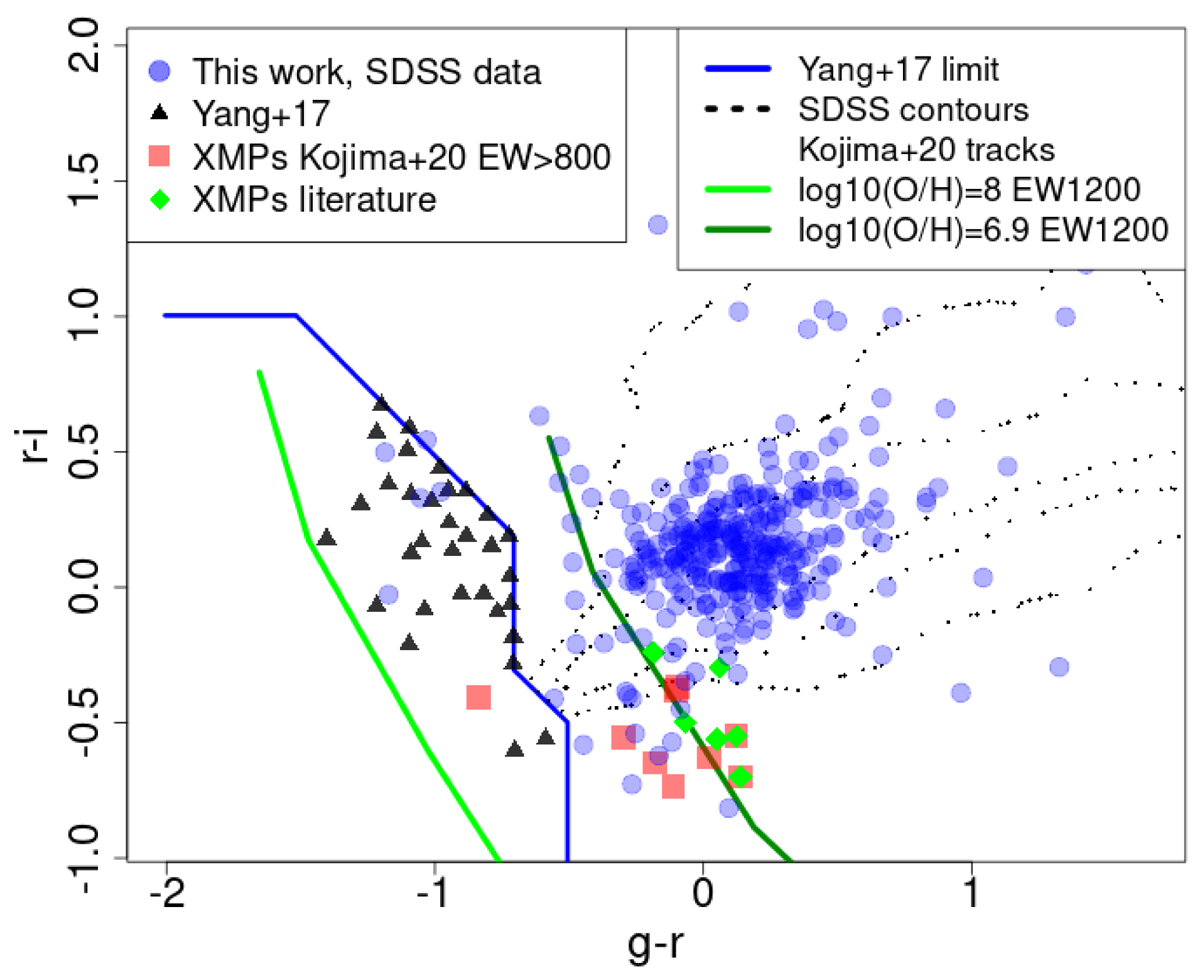
Fig. 17.
Download original image
Broadband color-color diagram, created using SDSS data. We plot our EELG sample in blue dots, alongside the blueberry galaxies in Yang et al. (2017) (black triangles) and samples of extremely metal poor galaxies (XMP) from Kojima et al. (2020) (red squares) and the other literature works (green diamonds), as reported in (Kojima et al. 2020). The blue line represent the Yang et al. (2017) sample selection limits, while the green lines follow the evolutionary tracks of models in Kojima et al. (2020). The small black dots represent the density contours of typical SDSS galaxies (Kojima et al. 2020).
Current usage metrics show cumulative count of Article Views (full-text article views including HTML views, PDF and ePub downloads, according to the available data) and Abstracts Views on Vision4Press platform.
Data correspond to usage on the plateform after 2015. The current usage metrics is available 48-96 hours after online publication and is updated daily on week days.
Initial download of the metrics may take a while.