Fig. 10.
Download original image
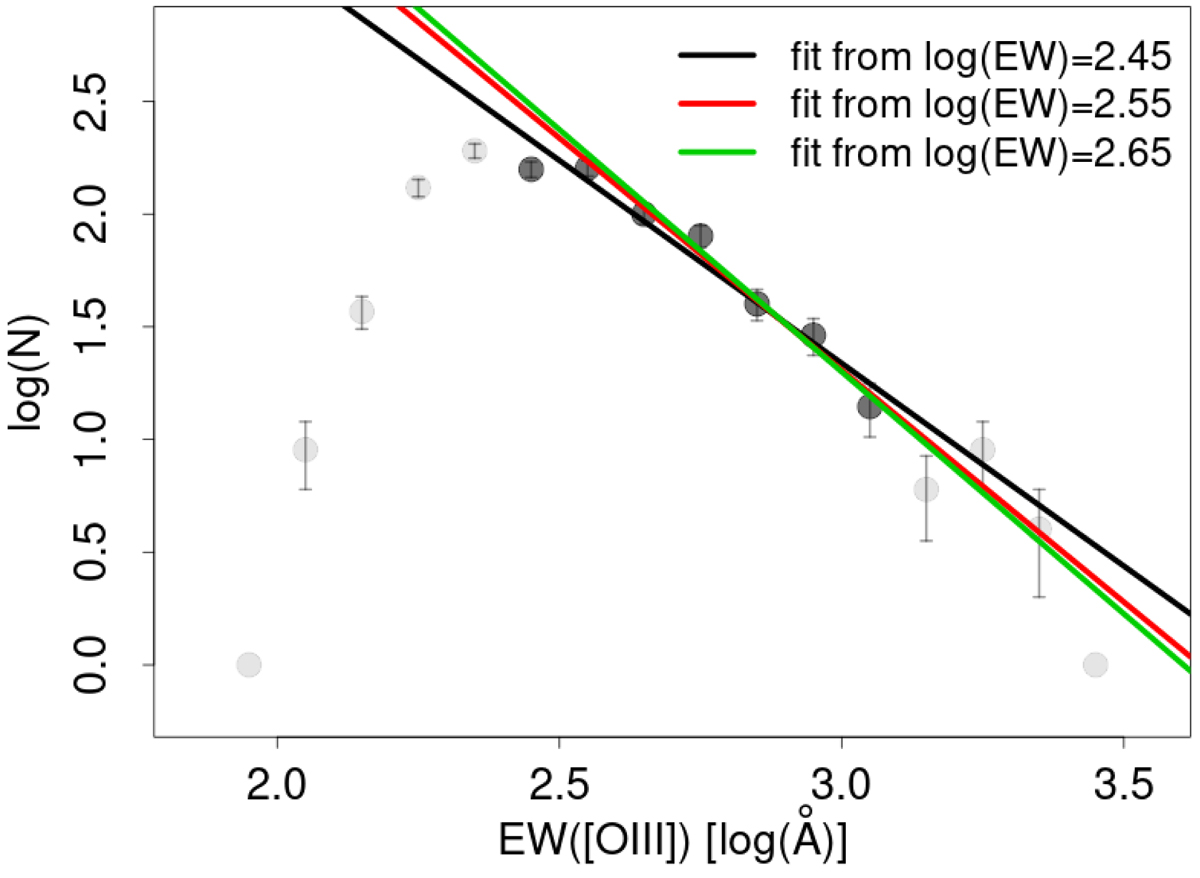
Diagram used to asses the completeness of the EELG sample. We plot the number of galaxies per bin of log(EW[OIII]) as a function of log(EW[OIII]). We overplot the linear fits to the data considering three different limits in the lower end, from 2.45 log(Å) (black line), 2.55 (red), and 2.65 (green). The points considered in at least one of the fits are shown in a darker shade of gray.
Current usage metrics show cumulative count of Article Views (full-text article views including HTML views, PDF and ePub downloads, according to the available data) and Abstracts Views on Vision4Press platform.
Data correspond to usage on the plateform after 2015. The current usage metrics is available 48-96 hours after online publication and is updated daily on week days.
Initial download of the metrics may take a while.