Fig. 1.
Download original image
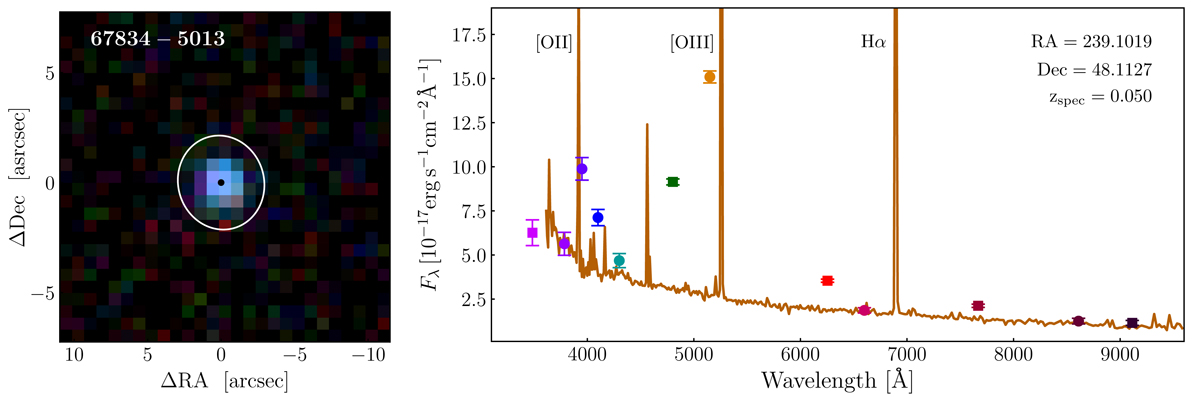
Illustrative example of an extreme [OIII] emitter, the J-PLUS source 67834-5013 (RA = 239.1019, Dec = 48.1127, zspec = 0.050). Left panel: color composite of the galaxy, obtained from the gri J-PLUS images. The sky location of the source is shown as a black dot, and the white ellipse indicates the three effective radius contours for the source. Right panel: J-PLUS 12-band PSFCOR photometry of the galaxy. The squares show the five SDSS-like filters (ugriz), and circles indicate the seven medium-band filters (J0378, J0395, J0410, J0430, J0515, J0660, and J0861). The solid line shows the spectra from SDSS with a downgraded resolution of R ∼ 180, normalized to the flux in the filter J0660. The location of the most prominent emission lines is marked: [OIII] (traced by J0515 and g), Hα (traced by r), and [OII] (traced by J0395).
Current usage metrics show cumulative count of Article Views (full-text article views including HTML views, PDF and ePub downloads, according to the available data) and Abstracts Views on Vision4Press platform.
Data correspond to usage on the plateform after 2015. The current usage metrics is available 48-96 hours after online publication and is updated daily on week days.
Initial download of the metrics may take a while.