Fig. 9
Download original image
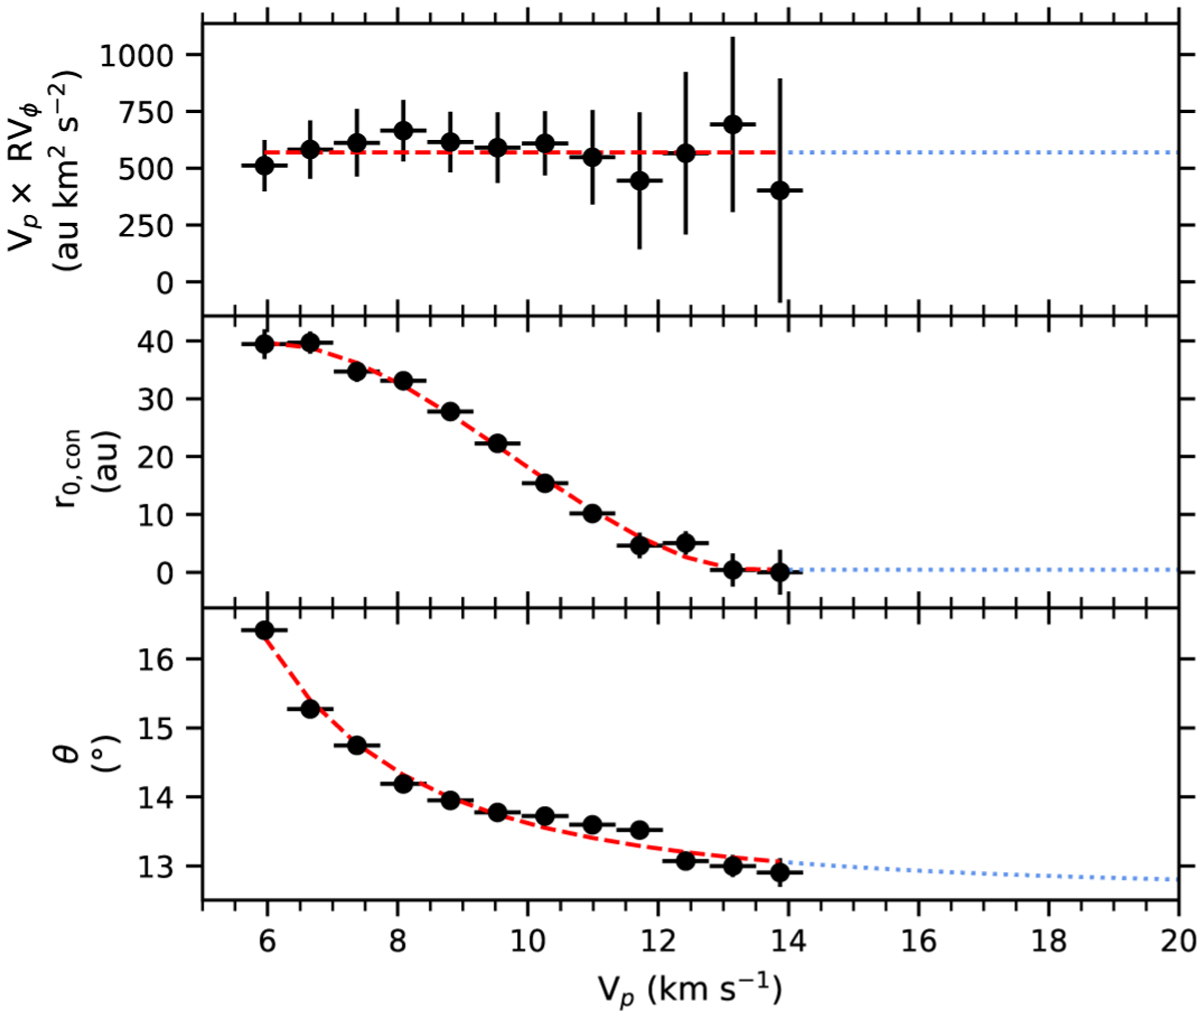
Disk-wind properties derived from the tomography along lines of constant VZ. Red dashed curves show fits as a function of the poloidal velocity of the streamline Vp: the anchoring radius of the streamline r0,con was fit by a third-order polynomial, the angle of the streamline with the flow axis θ by a power law and the product VP × j by a constant value of 570 au km2 s−2. Blue dotted lines represent the extrapolation used to model the high-velocity component that could not be mapped by tomography due to its low S/N.
Current usage metrics show cumulative count of Article Views (full-text article views including HTML views, PDF and ePub downloads, according to the available data) and Abstracts Views on Vision4Press platform.
Data correspond to usage on the plateform after 2015. The current usage metrics is available 48-96 hours after online publication and is updated daily on week days.
Initial download of the metrics may take a while.