Fig. 3
Download original image
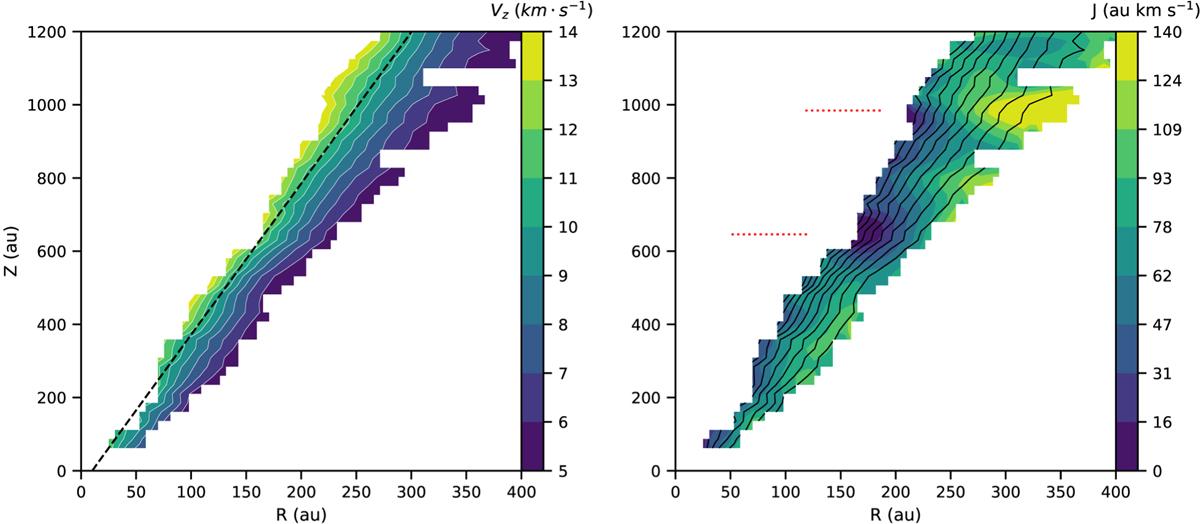
Tomographic maps of VZ (left panel) and specific angular momentum j (right panel) in the outflow referential. The black dashed line traces the conical fit of the region VZ = 10–11 km s−1. The white (resp. black) contours in the left (resp. right) panel show VZ contours. The red dashed lines indicate the heights of the two extrema in specific angular momentum.
Current usage metrics show cumulative count of Article Views (full-text article views including HTML views, PDF and ePub downloads, according to the available data) and Abstracts Views on Vision4Press platform.
Data correspond to usage on the plateform after 2015. The current usage metrics is available 48-96 hours after online publication and is updated daily on week days.
Initial download of the metrics may take a while.