Fig. D.2
Download original image
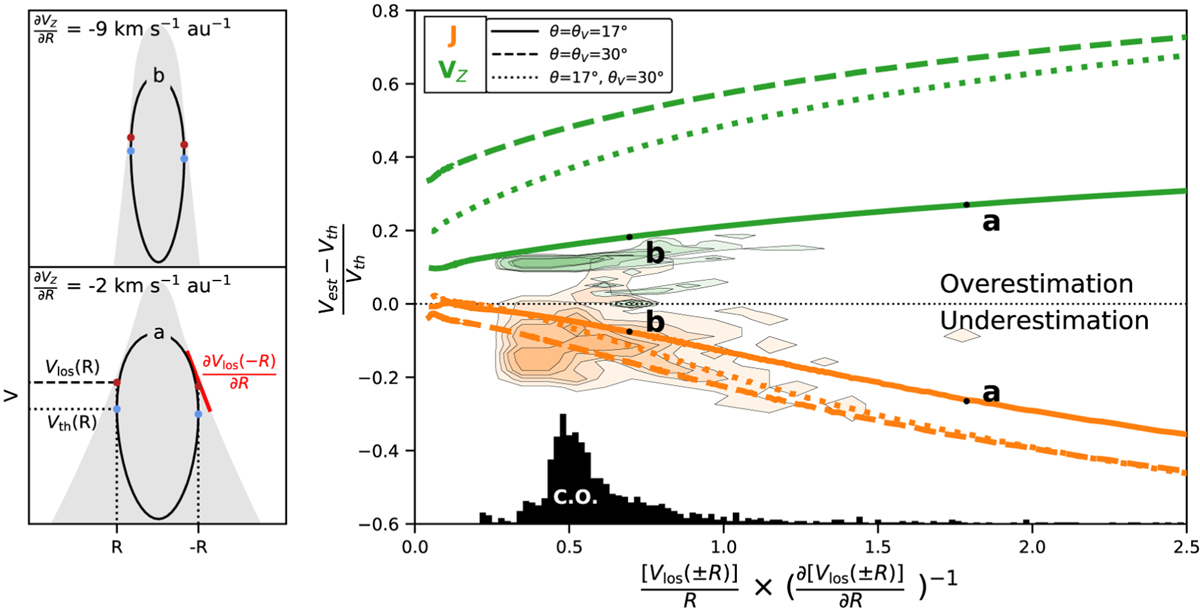
Biases in the tomographic reconstruction for a stacking of conical shells. Left panels: The gray area shows the limits of the transverse PV diagram predicted for a stacking of conical shells with a shearing factor fsh (see text). In black is shown the ellipse corresponding to a single layer of maximal radius R. The blue and red dots correspond respectively to the velocity of the ellipse at ±R and the maximal velocity of the PV diagram at ± R. The red dots are the ones used in our method, while the blue dots correspond to the true measurements. The differences in velocities will lead to a bias in our j and VZ estimation. The red line shows the slope of the PV diagram ![]() , see text for more details. Right panel: Plot of the relative bias in VZ (green curves) and j (orange curves) due to the shearing aspect of the PV diagram as a function of the x parameter (see text). The solid, dashed, and dotted lines correspond to different configurations of θ and θv. The black histogram, labeled C.O., shows the distribution of the x parameter derived at different heights Z and radii R in the conical outflow. The relative biases corresponding to the a and b ellipses shown in the left panels are represented. The orange (resp. green) colored contours trace the relative biases derived from applying the tomographic method to the synthetic data cube. Contours outline 30 to 90 % of the distributions in step of 15 %.
, see text for more details. Right panel: Plot of the relative bias in VZ (green curves) and j (orange curves) due to the shearing aspect of the PV diagram as a function of the x parameter (see text). The solid, dashed, and dotted lines correspond to different configurations of θ and θv. The black histogram, labeled C.O., shows the distribution of the x parameter derived at different heights Z and radii R in the conical outflow. The relative biases corresponding to the a and b ellipses shown in the left panels are represented. The orange (resp. green) colored contours trace the relative biases derived from applying the tomographic method to the synthetic data cube. Contours outline 30 to 90 % of the distributions in step of 15 %.
Current usage metrics show cumulative count of Article Views (full-text article views including HTML views, PDF and ePub downloads, according to the available data) and Abstracts Views on Vision4Press platform.
Data correspond to usage on the plateform after 2015. The current usage metrics is available 48-96 hours after online publication and is updated daily on week days.
Initial download of the metrics may take a while.