Fig. D.1
Download original image
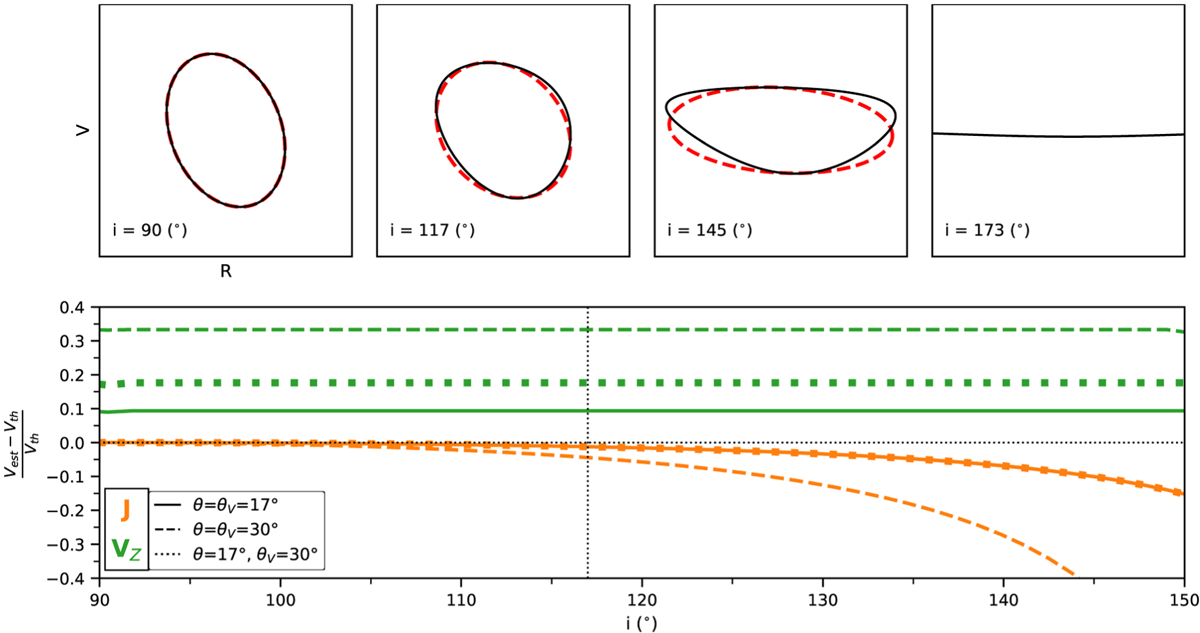
Biases in the tomographic reconstruction for one single conical shell. Top panels: Black curves show computed transverse PV diagrams for one conical layer with constant VZ, VR, and j seen at different inclinations i and with θV = θ = 17°. The red dashed curve traces an elliptical fit. Bottom Panel: Computed relative bias in VZ (green curves) and j (orange curves) for one conical layer as a function of the inclination and for different combinations of θ and θv: solid curves: θ = θv = 17°, dotted curves: θ = 17° & θv = 30°, and dashed curves: θ = θv = 30°.
Current usage metrics show cumulative count of Article Views (full-text article views including HTML views, PDF and ePub downloads, according to the available data) and Abstracts Views on Vision4Press platform.
Data correspond to usage on the plateform after 2015. The current usage metrics is available 48-96 hours after online publication and is updated daily on week days.
Initial download of the metrics may take a while.