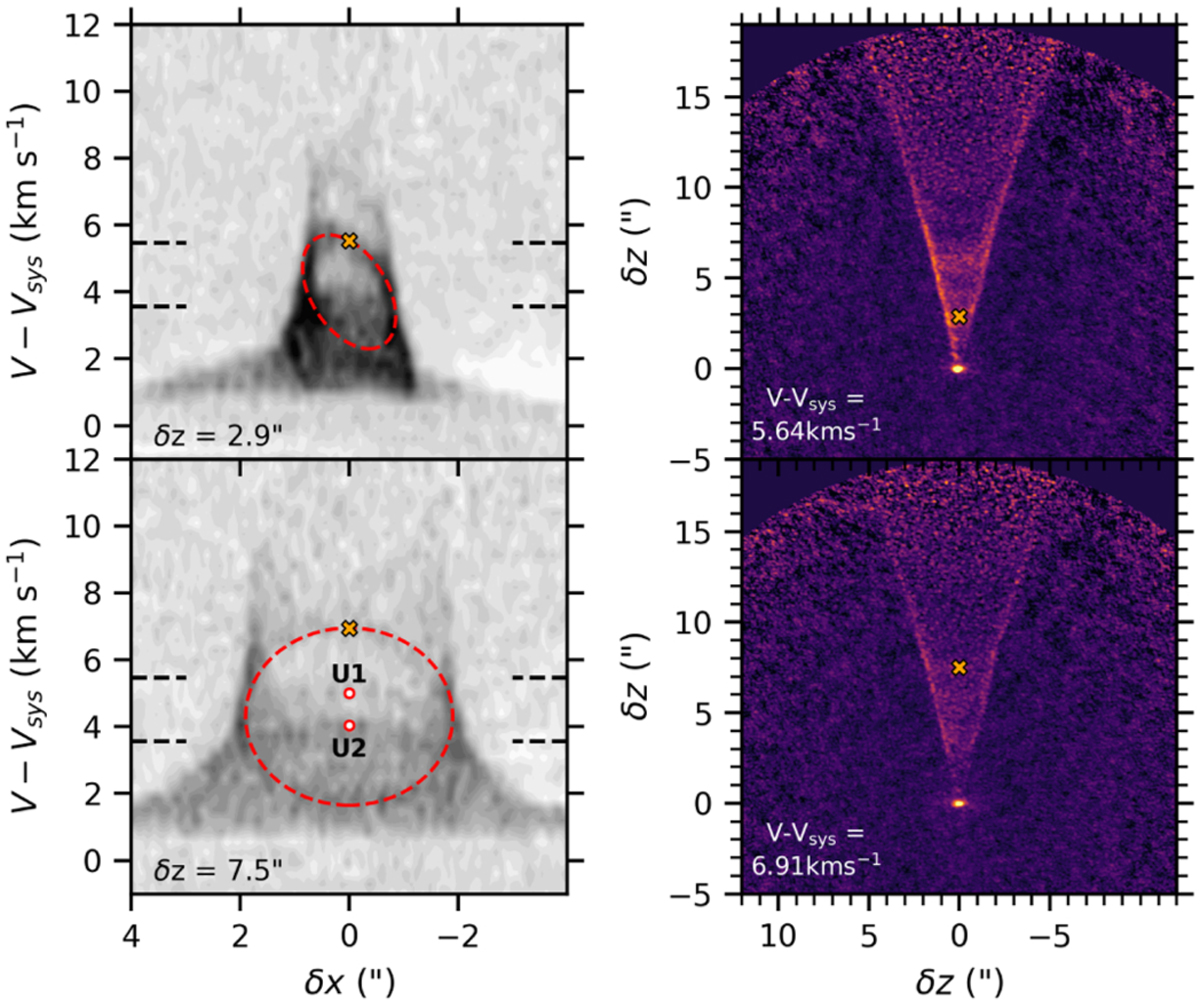
Fig. C.2
Download original image
Illustration of the correspondences between ellipses and cusps. Left panels: transverse PV diagrams at δz = 2.9″ and 7.5″ (from Fig C.1), with red dots indicating the on-axis projected velocities of cusps U1 and U2 at δz = 7.5″. Each of these two cusps corresponds in position and velocity to the maximum velocity (back side) of an ellipse in the PV cut. Right panels: channel maps at the same line-of-sight velocity as the orange crosses in the left panels, showing that elliptical structures seem to correspond to fainter cusps in position-position space, but falling outside of the velocity domain where cusp characterization was possible.
Current usage metrics show cumulative count of Article Views (full-text article views including HTML views, PDF and ePub downloads, according to the available data) and Abstracts Views on Vision4Press platform.
Data correspond to usage on the plateform after 2015. The current usage metrics is available 48-96 hours after online publication and is updated daily on week days.
Initial download of the metrics may take a while.