Fig. C.1
Download original image
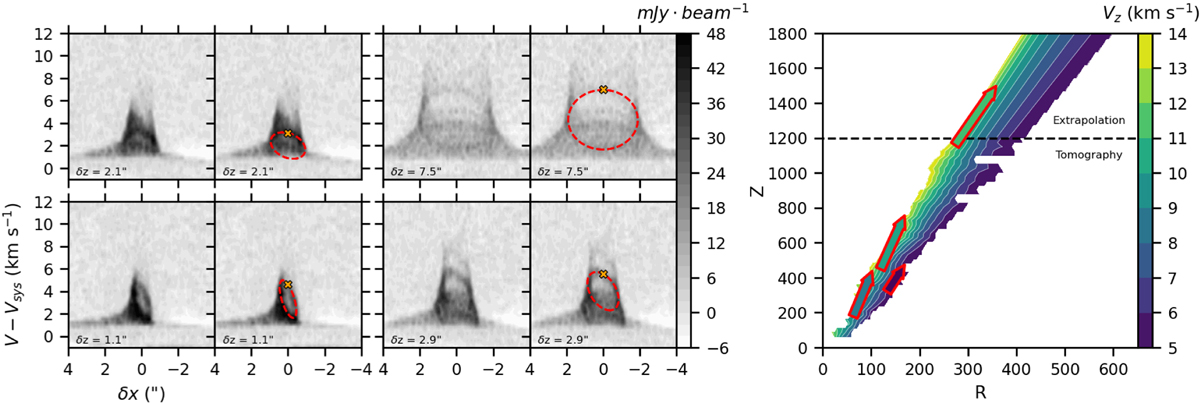
Constraints on the radial velocity component VR. Left panels: Transverse PV diagrams averaged over a slice of width ∆Z = 0.2″ at selected positions δz along the flow. In red are shown the ellipse fits. We show side by side the PV diagram with and without the fit for more visibility. Right panel: VZ tomography of the outflow in the outflow referential, extrapolated beyond Z > 1200 au. The red arrows represent the velocity directions determined from the ellipse fits. The arrow colors trace the VZ values determined from the ellipse fit. R and Z units are in au.
Current usage metrics show cumulative count of Article Views (full-text article views including HTML views, PDF and ePub downloads, according to the available data) and Abstracts Views on Vision4Press platform.
Data correspond to usage on the plateform after 2015. The current usage metrics is available 48-96 hours after online publication and is updated daily on week days.
Initial download of the metrics may take a while.