Fig. B.1
Download original image
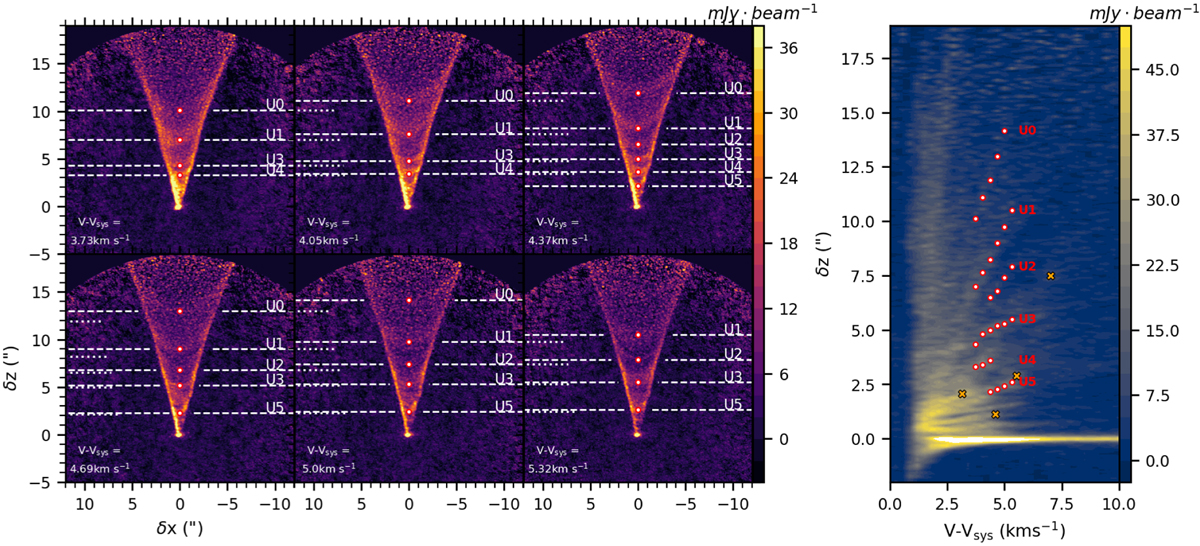
Characterization of the cusps. Left panels: Individual 12CO channel maps at different line-of-sight velocities illustrating the spatial evolution of the cusps. Six cusps, labeled U0-U5, are clearly identified (U4 is only visible on three channel maps). We identify the projected heights of the bottom of the cusps (red circles) and their evolution in the channel maps (white dashed lines). Right panel: Longitudinal PV diagram at δx = 0″ averaged over a slice of ∆x = 0.2″. The velocity and height locations of the cusps derived in the channel maps are shown as red dots. The four orange crosses indicate the maximum on-axis projected velocity (back side) of the top of the fit four bright elliptical structures identified in transverse PV diagrams at the corresponding heights (see Fig. C.1).
Current usage metrics show cumulative count of Article Views (full-text article views including HTML views, PDF and ePub downloads, according to the available data) and Abstracts Views on Vision4Press platform.
Data correspond to usage on the plateform after 2015. The current usage metrics is available 48-96 hours after online publication and is updated daily on week days.
Initial download of the metrics may take a while.