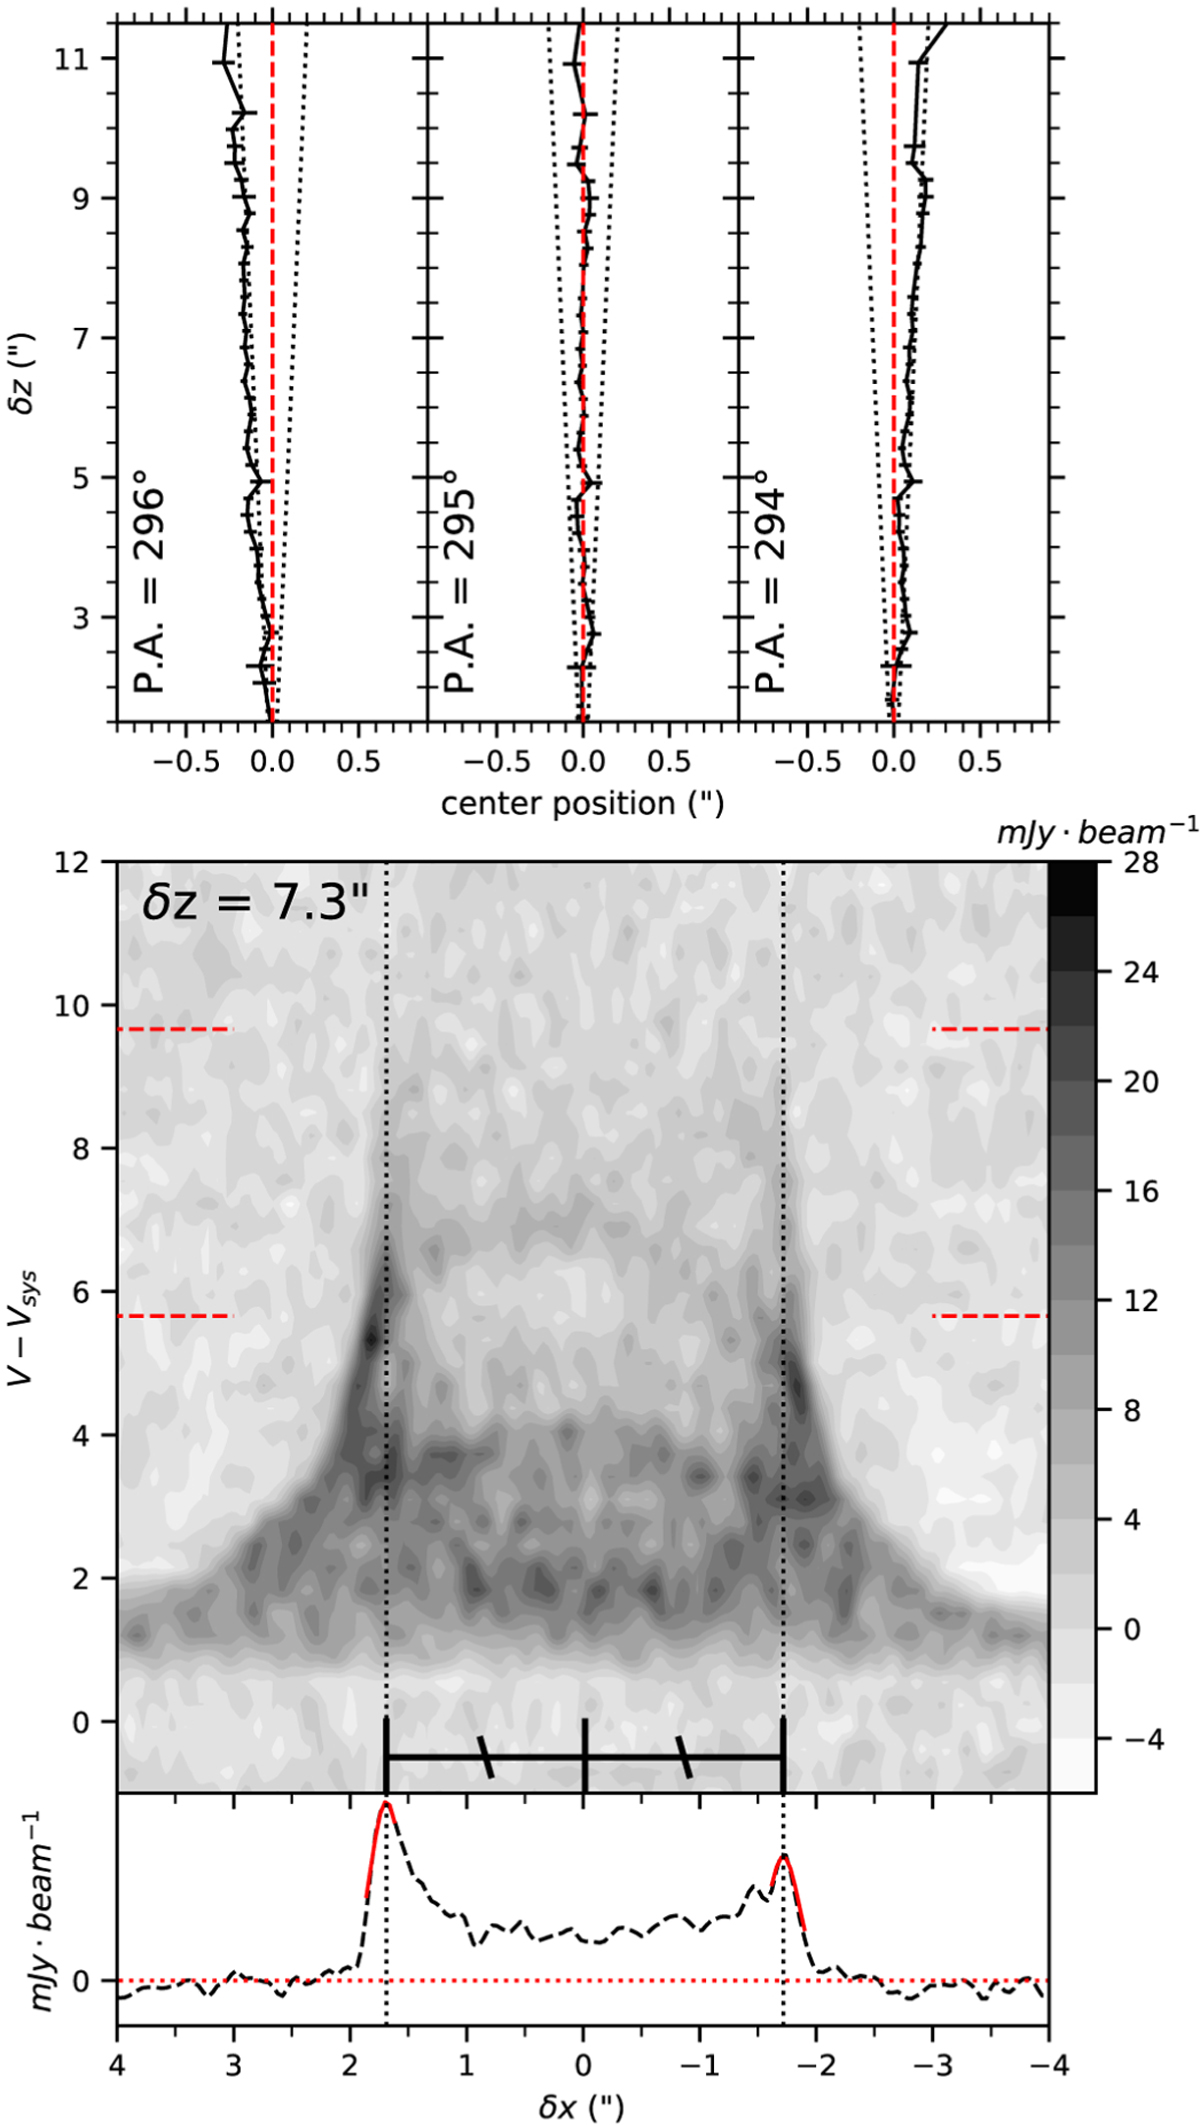
Fig. A.1
Download original image
Determination of the outflow axis PA. Top panels: Determination of the high-velocity component radial center as a function of projected heights above the disk for different outflow axis PA orientations. The black dotted lines show an angle of ±1° with respect to the central axis. Middle panel: 12CO PV diagram perpendicular to the outflow axis. (V − Vsys) unit is km s−1. Bottom panel: The black dashed profile shows the emissivity integrated from the PV diagram between (V − Vsys) = 6.64 km s−1 to (V − Vsys) = 9.77 km s−1, this domain is indicated by the red dashed lines in the middle panel. The red curves show Gaussian fits used to derive the radial positions of the two edge peaks. The vertical black dotted lines in the bottom and middle panels indicate the positions of these peaks. The average of these two radial positions give the radial center at this height.
Current usage metrics show cumulative count of Article Views (full-text article views including HTML views, PDF and ePub downloads, according to the available data) and Abstracts Views on Vision4Press platform.
Data correspond to usage on the plateform after 2015. The current usage metrics is available 48-96 hours after online publication and is updated daily on week days.
Initial download of the metrics may take a while.