Fig. 2
Download original image
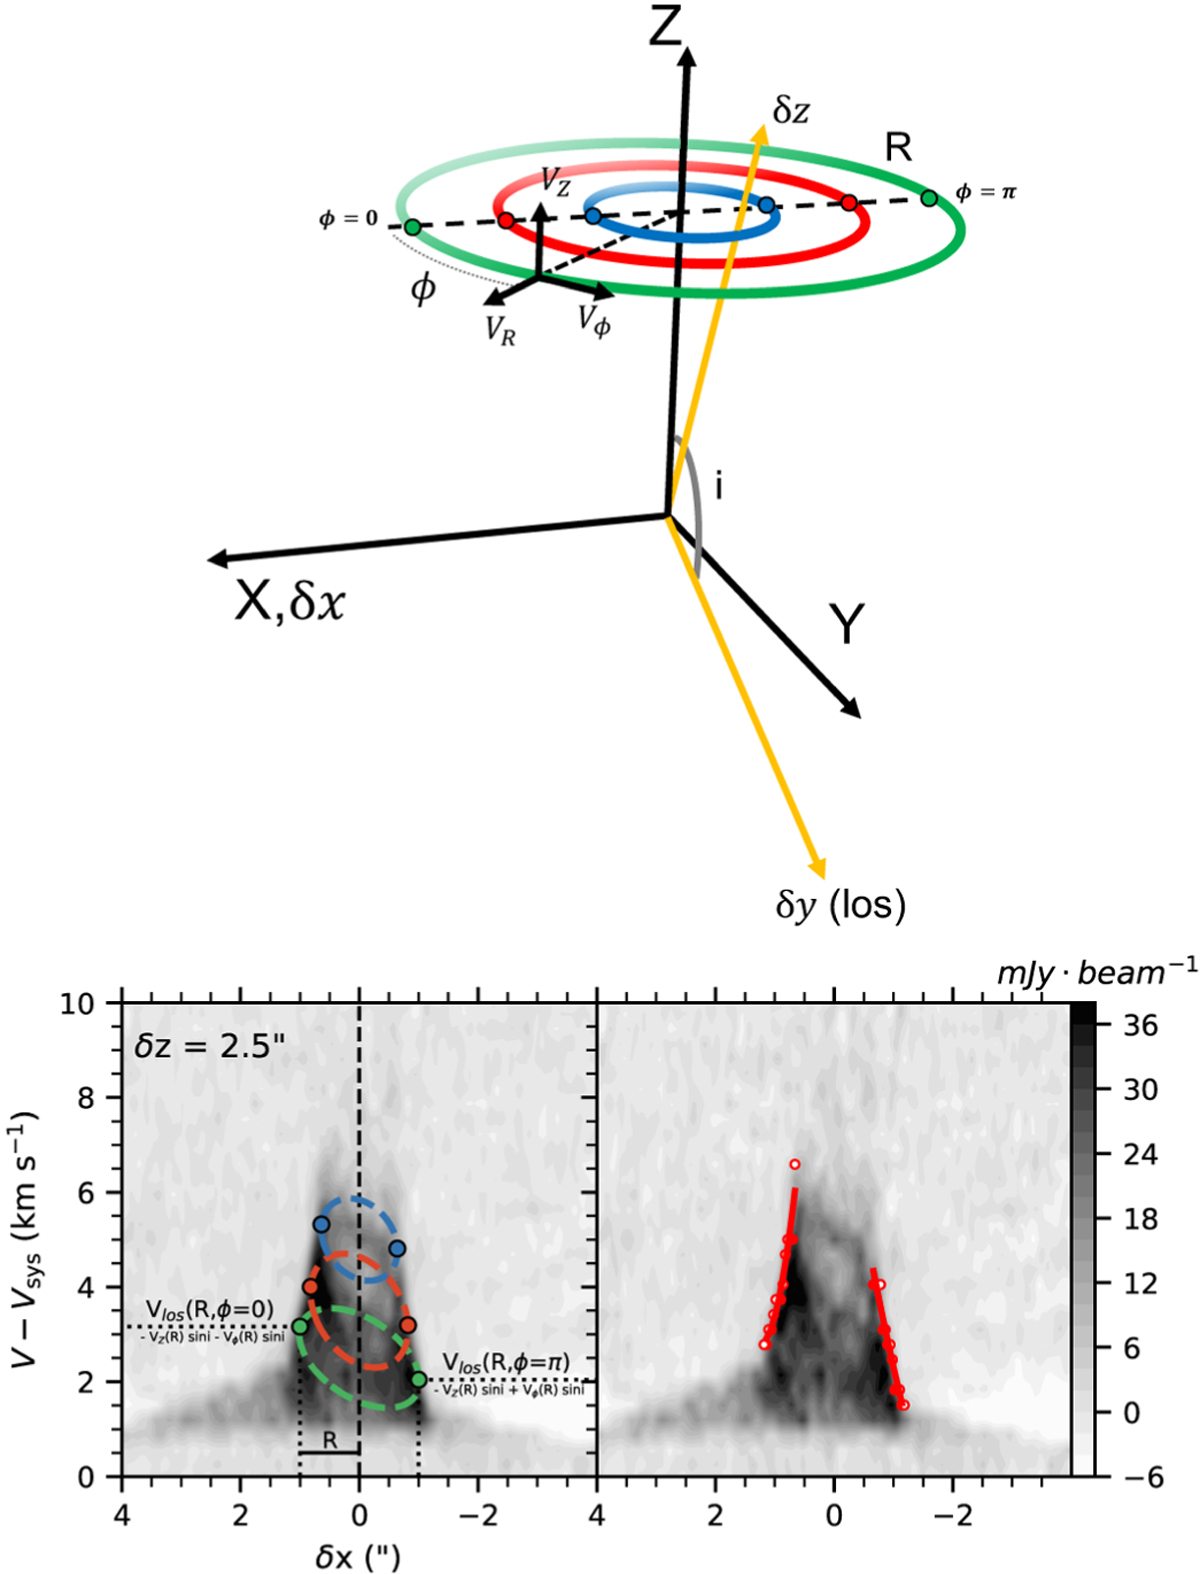
Principle of tomographic reconstruction method. Top panel: 3D representation of the two reference systems used: the outflow (X, Y, Z) in black and the observer (δx, δy, δz) in yellow. The colored circles illustrate the emitting rings defined by five parameters (see text). The colored dots trace the locations at ϕ = 0 and ϕ = π along the emitting rings. Bottom panels: transverse PV diagrams at δz = 2.5″ across the flow axis and averaged over a slice of ∆z = 0.2″. In the left panel is shown the schematic projection of the colored rings and corresponding colored dots in the PV diagram. Because of the flow inclination, the rings are in fact projected at slightly different heights. Their real projection is studied in Appendix D.1. The white dots in the right panel illustrate the outer limits of the PV diagram. The red curve shows the polynomial fitting of the two edges.
Current usage metrics show cumulative count of Article Views (full-text article views including HTML views, PDF and ePub downloads, according to the available data) and Abstracts Views on Vision4Press platform.
Data correspond to usage on the plateform after 2015. The current usage metrics is available 48-96 hours after online publication and is updated daily on week days.
Initial download of the metrics may take a while.