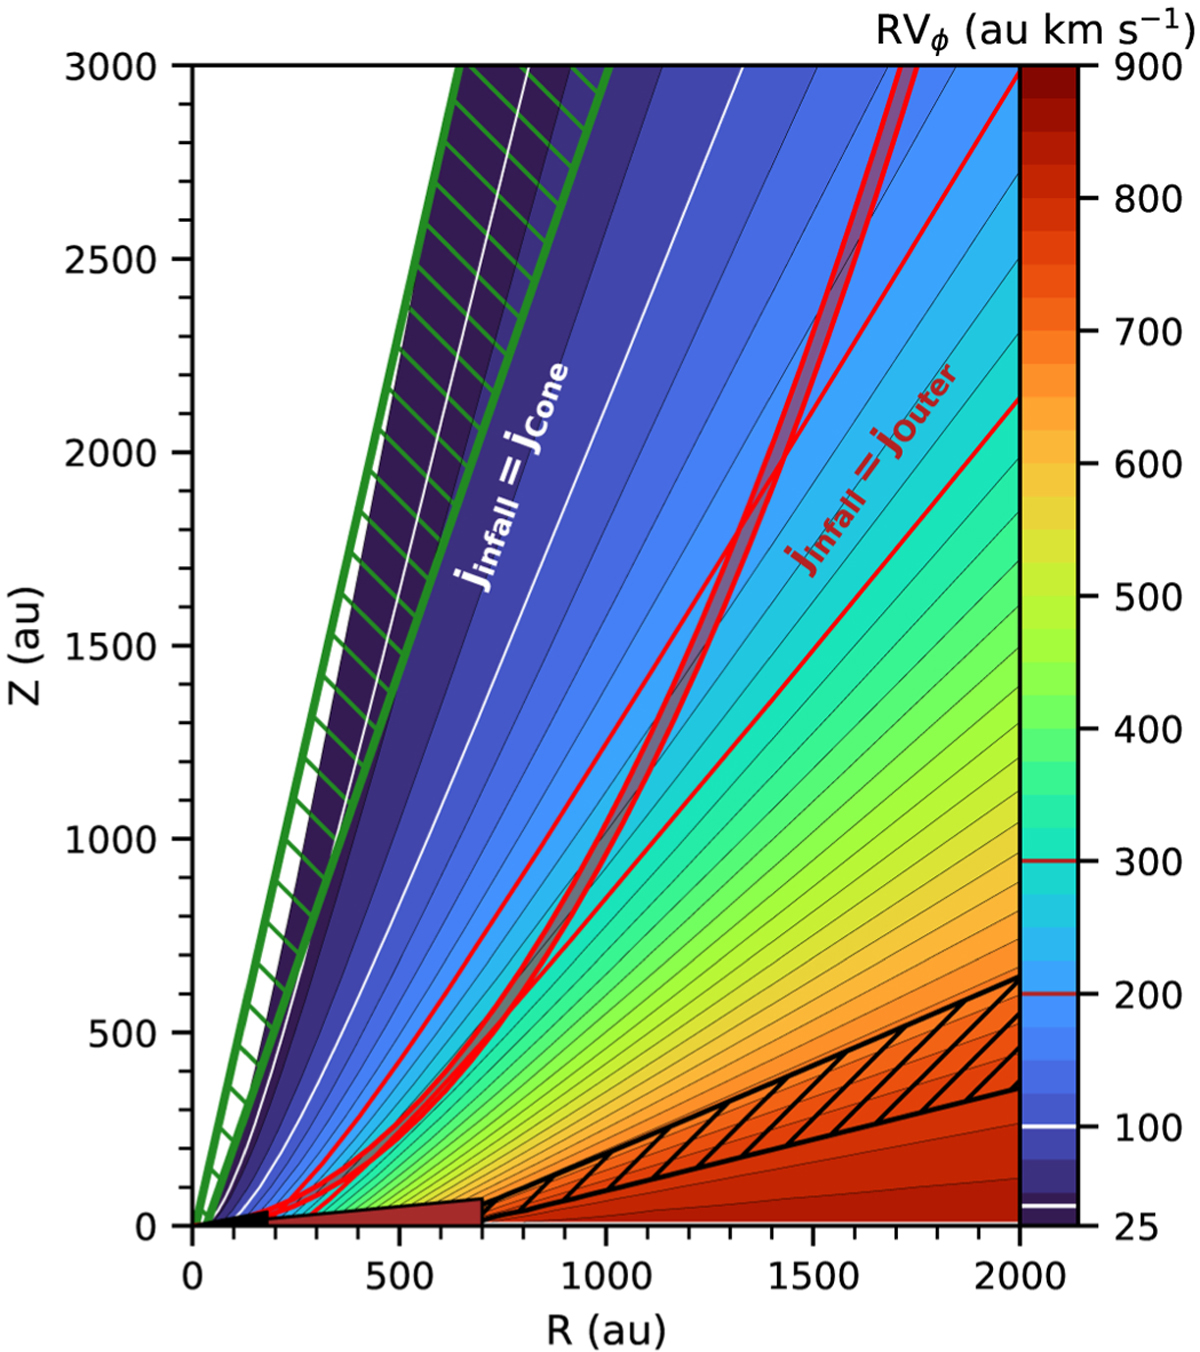
Fig. 16
Download original image
Specific angular momentum map (in color) for the model of ballistic rotating infall (Ulrich 1976) with Rd = 700 au and M* = 1.1 M⊙. The angular momentum varies from 25 au km s−1 to 900 au km s−1. The green hatched and red filled regions represent respectively the limits of the conical outflow derived from the tomography in Sect. 3 and the parabolic shape of the classical Hubble-law WDS model fit to the external CO outflow. The white and red contours outline the infalling streamlines with a specific angular momentum similar to the conical outflow j = 40–100 au km s−1 (white), and to the WDS model j = 200–300 au km s−1 (red). The black hatched region outline the streamlines with initial θ0 = 70 ± 5° reproducing the infall signatures seen in DG Tau B (DV20).
Current usage metrics show cumulative count of Article Views (full-text article views including HTML views, PDF and ePub downloads, according to the available data) and Abstracts Views on Vision4Press platform.
Data correspond to usage on the plateform after 2015. The current usage metrics is available 48-96 hours after online publication and is updated daily on week days.
Initial download of the metrics may take a while.