Open Access
Fig. 15
Download original image
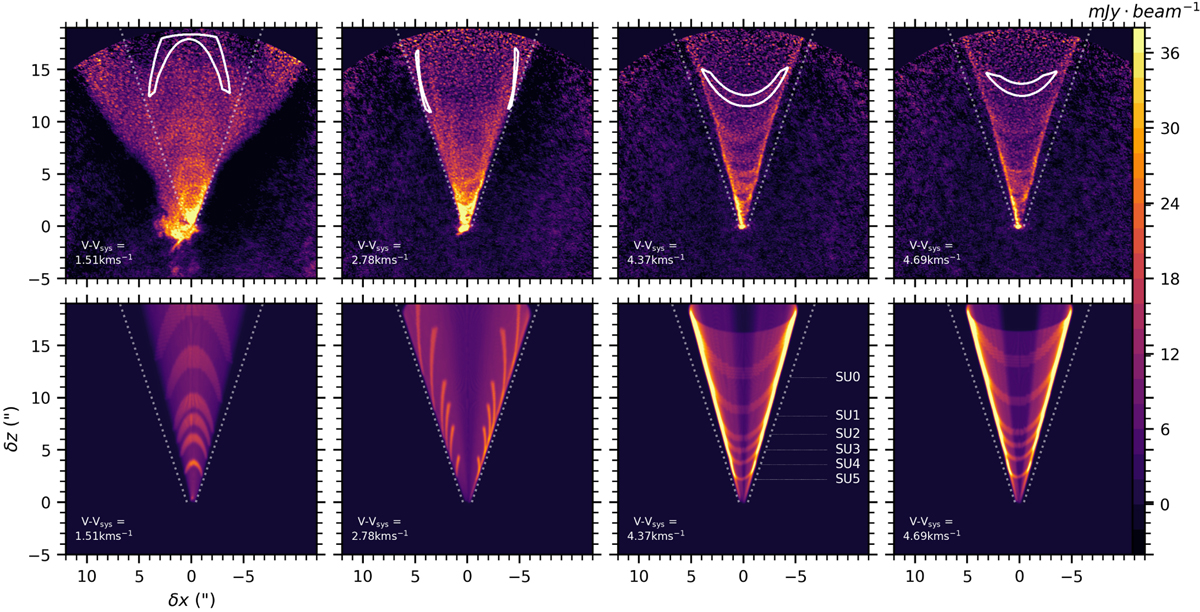
12CO channel maps at selected line-of-sight velocities for the steady conical disk-wind model (bottom row) and observations (top row). White contours highlight the predicted emission from the modeled density enhancement SU0. The intensity color scale is the same for all channel maps.
Current usage metrics show cumulative count of Article Views (full-text article views including HTML views, PDF and ePub downloads, according to the available data) and Abstracts Views on Vision4Press platform.
Data correspond to usage on the plateform after 2015. The current usage metrics is available 48-96 hours after online publication and is updated daily on week days.
Initial download of the metrics may take a while.